The AP on the Street 43rd week of 2023 – Trending Factors

The AP on the Street 43rd week of 2023 – Trending Factors
The third factor-driven weekly newsletter is here. Let’s look at the trending factors from last week (23.10.2023 – 27.10.2023) as detected by our factor investing software.
Trending factors from last week
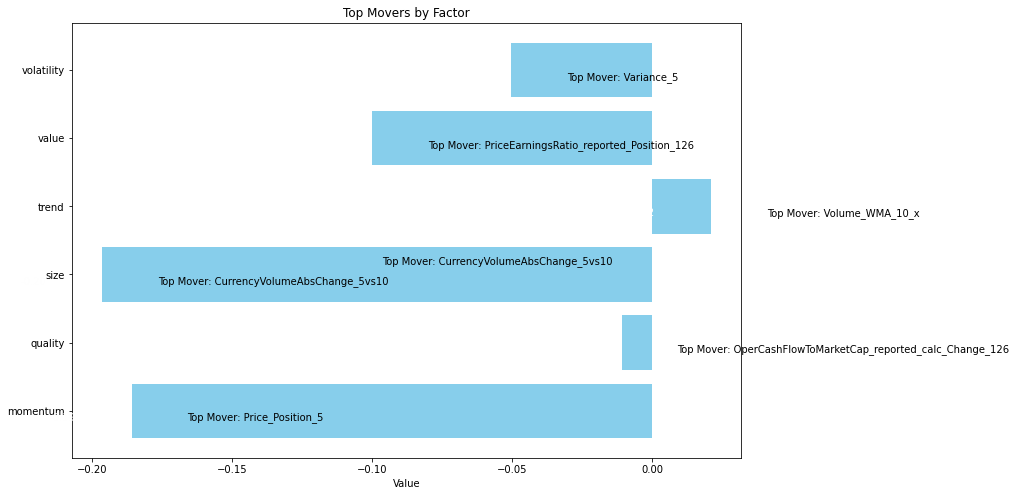
Factor Statistics 23.10.2023 – 27.10.2023
| Row | Factor group | Group total | Top mover within the factor group | Mover value |
| 0 | momentum | -0.1859 | Price_Position_5 | +2.7553 |
| 1 | quality | -0.0110 | OperCashFlowToMarketCap_reported_calc_Change_126 | -0.3668 |
| 2 | size | -0.1964 | CurrencyVolumeAbsChange_5vs10 | -1.2184 |
| 3 | trend | 0.0209 | Volume_WMA_10_x | +0.1351 |
| 4 | value | -0.1001 | PriceEarningsRatio_reported_Position_126 | -0.3346 |
| 5 | volatility | -0.0504 | Variance_5 | +1.7046 |
The exposure/impact of momentum factors on the S&P 100 returns went down 19% (-0.1859) since the last week. Moreover, the week before there was a decline of 27%, and the week before another 22%). Overall, Momentum has already lost 54% of the impact on the price movement during the period we track! It means that the category of momentum indicators became less important.
Within the momentum factor group, the Price position 5 jumped up by a whopping 276%, indicating strong performance. This increase brings the relative price close to its all-time high, highlighting its robust performance. This can be a strong buy signal for potential buyers who believe in this momentum indicator.
Let’s take a look at how traders who believed in the two most trending factors have fared in recent years
Statistics for factors
Factor Statistics 1990 – 2023
| Row | Factor | T-Stat | P-Value | Direction |
| 0 | Price_Position_5 | 3.7987 | 0.000084 | -1.0 |
| 1 | OperCashFlowToMarketCap_reported_calc_Change_126 | 0.7742 | 0.219607 | +1.0 |
| 2 | CurrencyVolumeAbsChange_5vs10 | 1.2932 | 0.098331 | +1.0 |
| 3 | Volume_WMA_10_x | 2.3586 | 0.009408 | +1.0 |
| 4 | PriceEarningsRatio_reported_Position_126 | 1.4399 | 0.075327 | -1.0 |
| 5 | Variance_5 | 0.1940 | 0.423119 | +1.0 |
In the table, we can see the T-Stat and P-Value for the entire period of history for which we evaluate the factors, i.e. 1990 – 2023. The Direction value shows the direction in which the factor affects the movement of the share price, +1 expresses the positive impact of the increasing factor on the share price, and -1 expresses the negative impact of the increasing value of the factor on the share price.
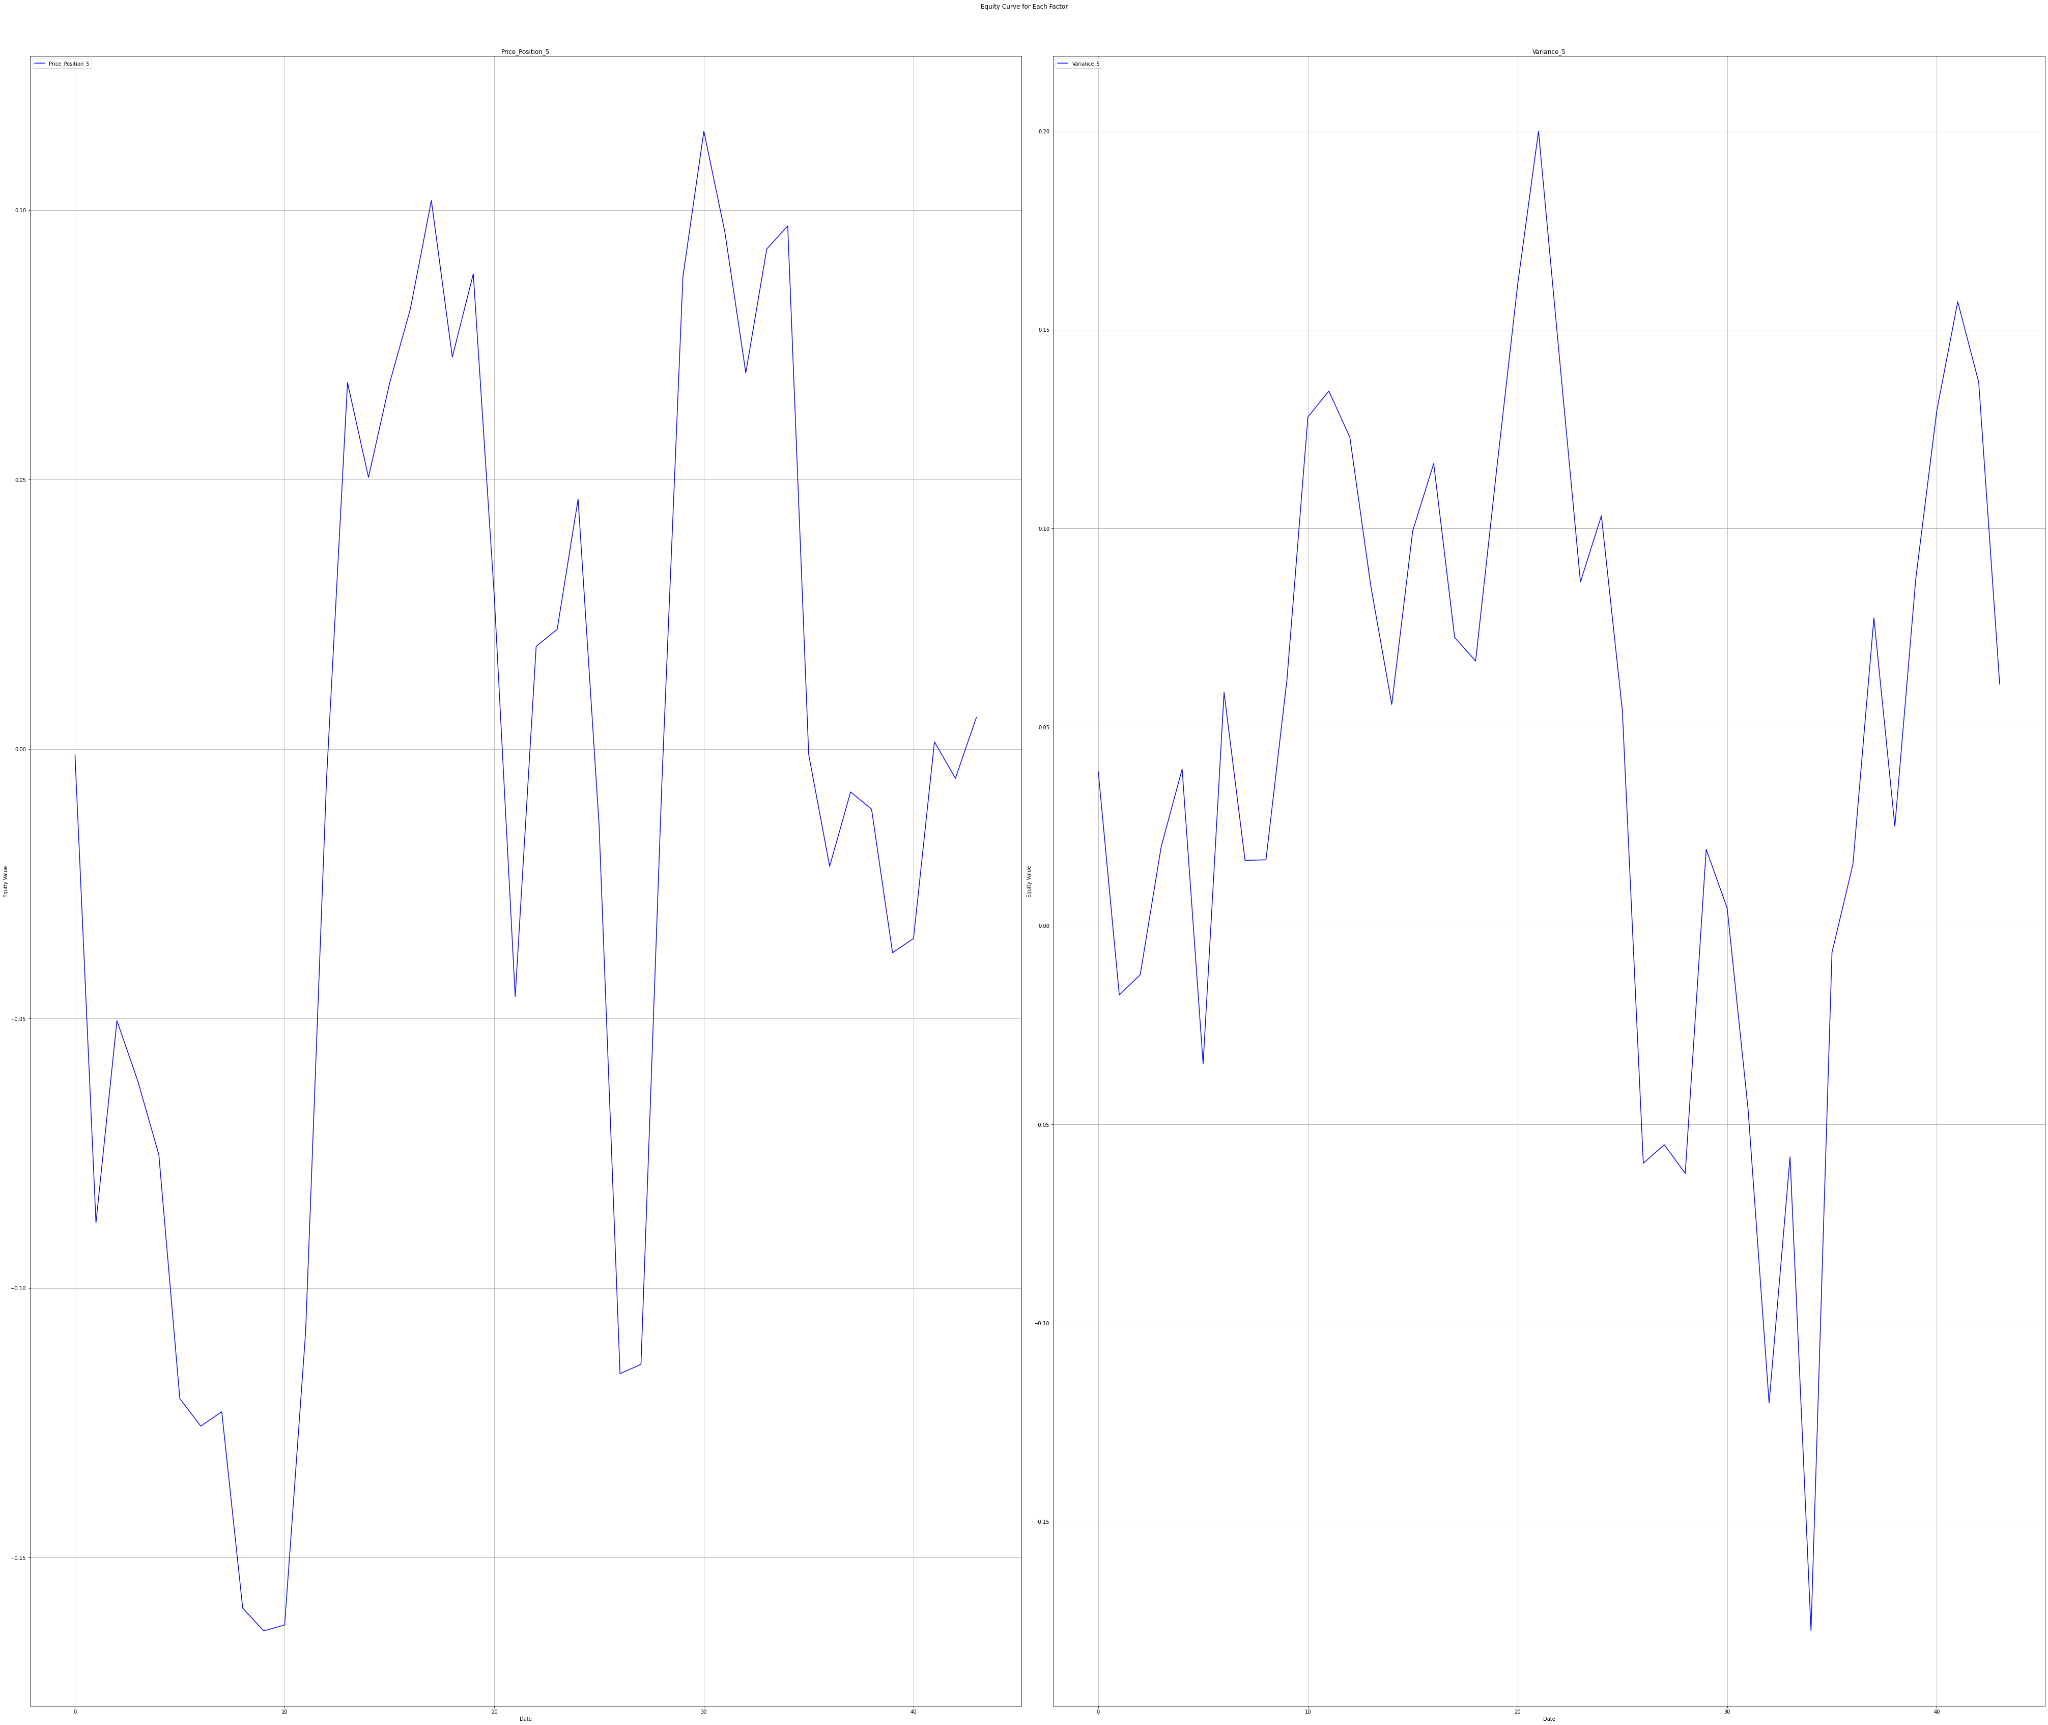
The charts below show Factor Statistics 1990 – 2023 for the 2 most moving factors from the previous week.
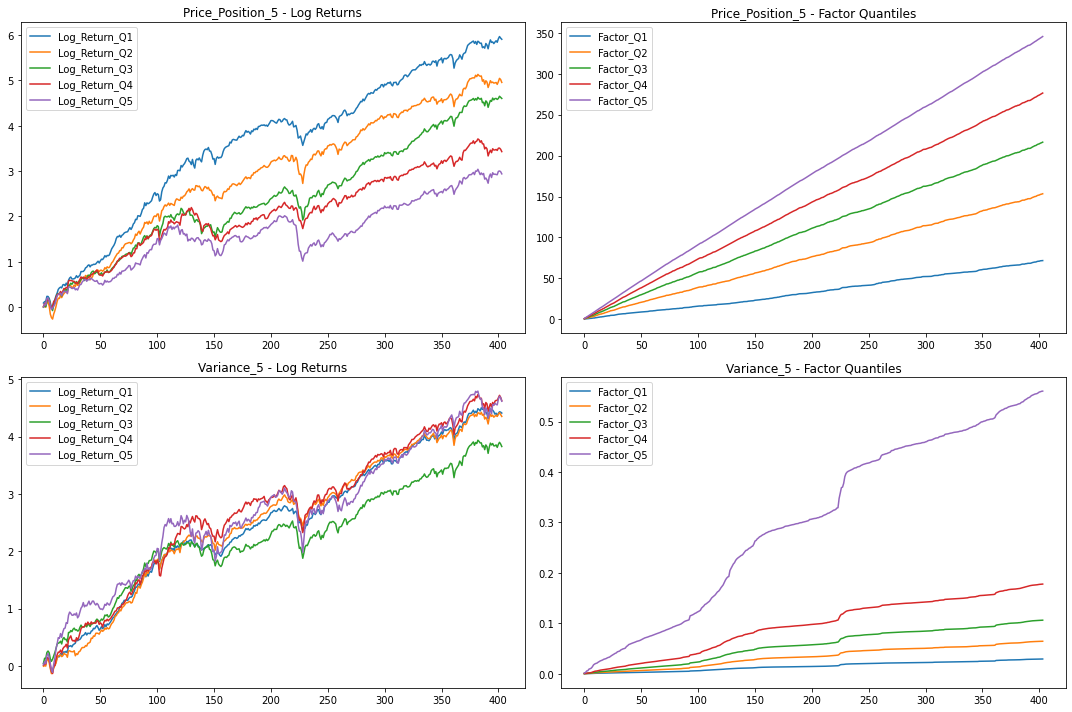
We can note that betting on the Price Position 5 factor in the period 1990-2023 has generally produced very good results (The lines in the Log Return are nicely separated and the returns correspond to the quantiles). On the other hand, in the case of Variance 5, the returns by quantile overlap and there is no apparent statistical advantage. This is also confirmed by the hypothetical Long/Short portfolio where we bet 50% on Q1 and 50% on Q5. See the results below.
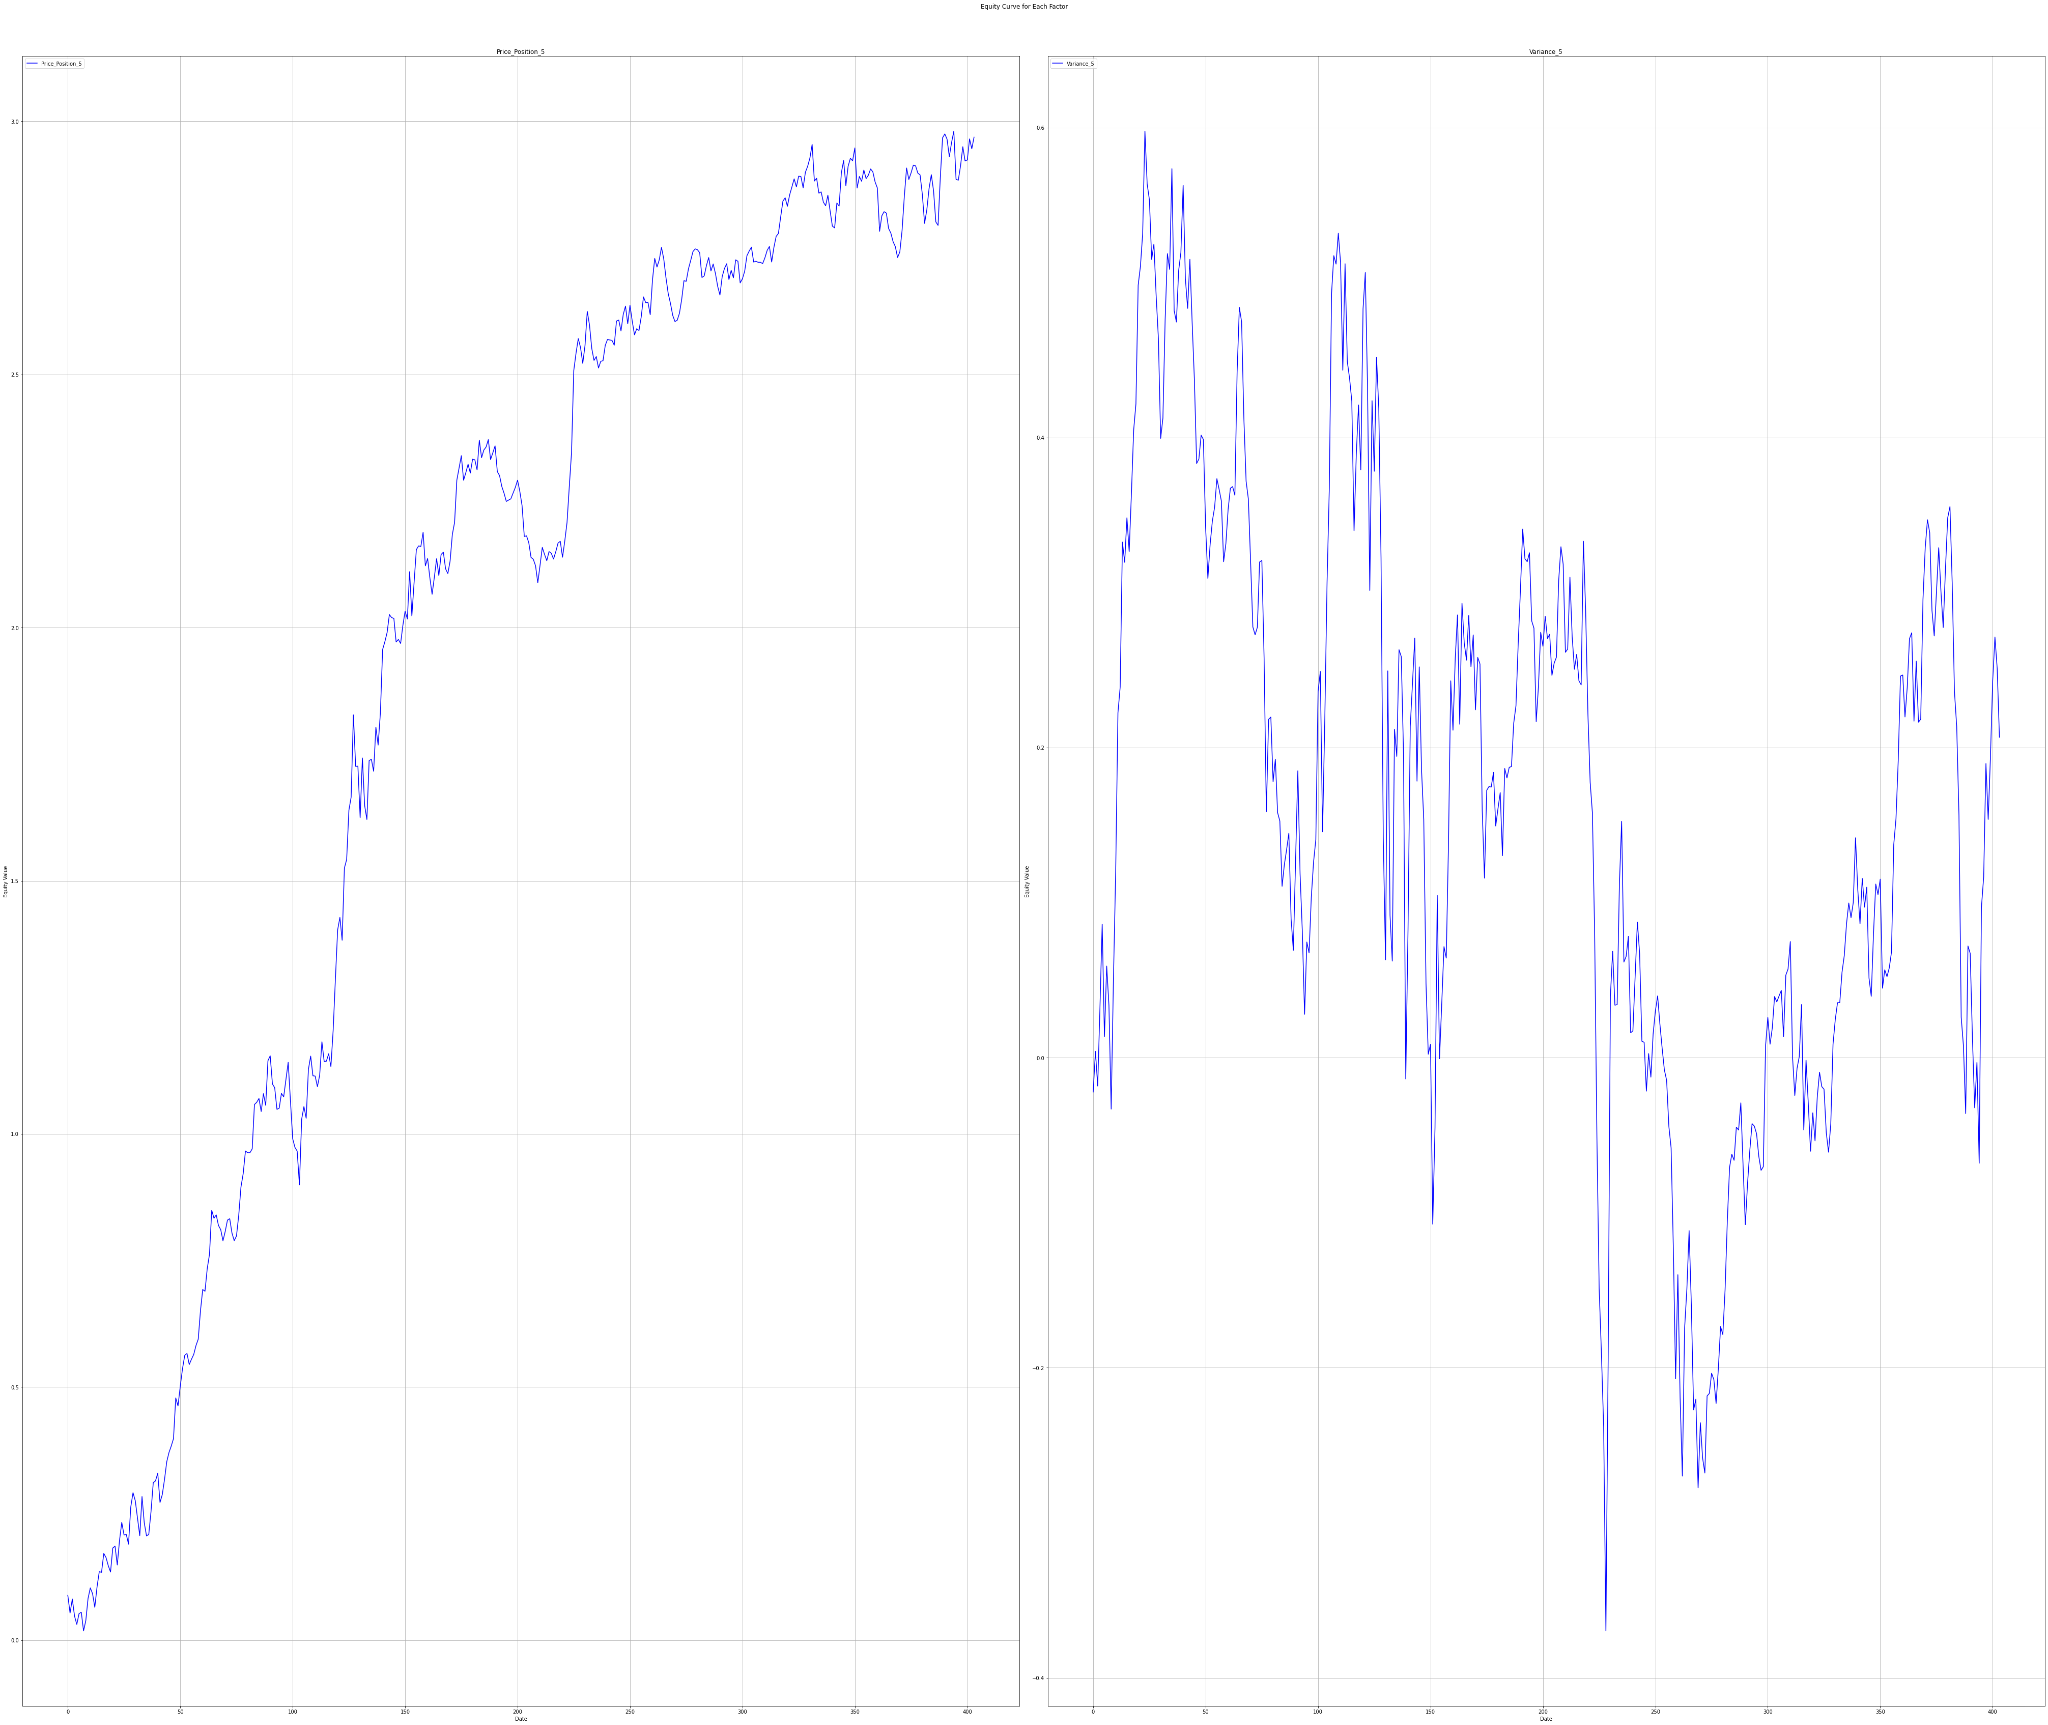
Factor Statistics 2020 – 2023
| Row | Factor | T-Stat | P-Value | Direction |
| 0 | Price_Position_5 | -0.0186 | 0.507412 | -1.0 |
| 1 | OperCashFlowToMarketCap_reported_calc_Change_126 | 0.0004 | 0.499837 | +1.0 |
| 2 | CurrencyVolumeAbsChange_5vs10 | 0.9819 | 0.1658140 | +1.0 |
| 3 | Volume_WMA_10_x | 0.1843 | 0.427305 | +1.0 |
| 4 | PriceEarningsRatio_reported_Position_126 | 0.3367 | 0.368989 | +1.0 |
| 5 | Variance_5 | 0.1577 | 0.4376882 | +1.0 |
In the table for the last 3 years, we can see that the Price Earning Ratio reported Position 126 factor had the opposite effect on the share price than in the whole long-term history.
The charts below show Factor Statistics 2020 – 2023 for the 2 most moving factors from the previous week.
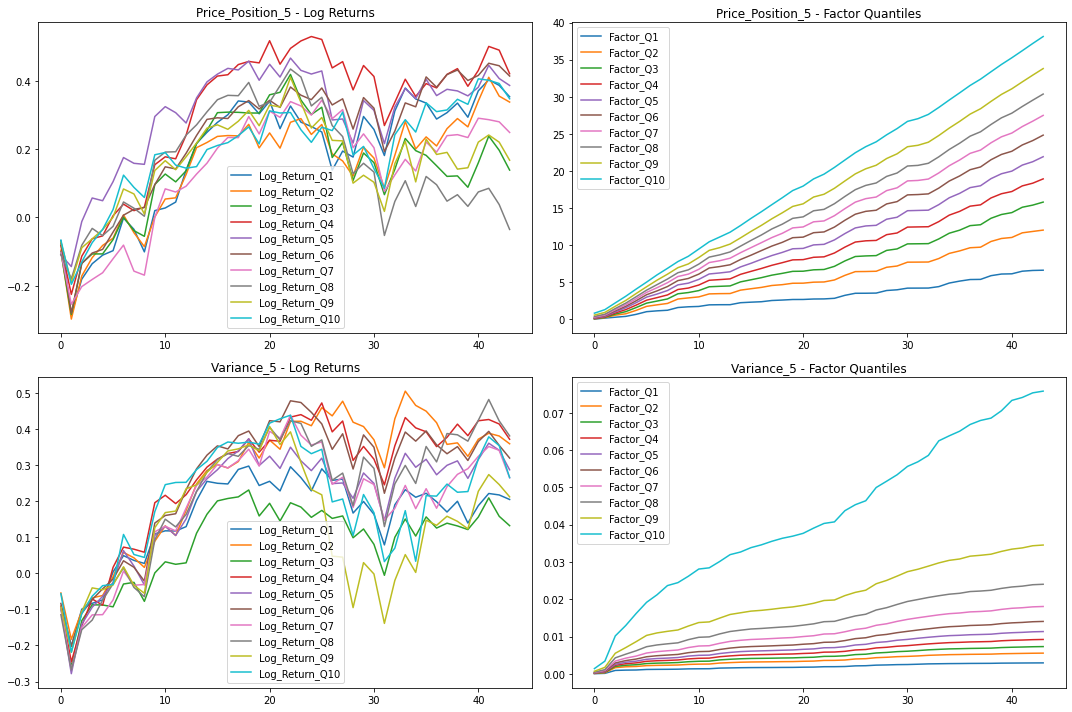
We can note that betting on both of these factors did not add value in the 2020-2023 period.
Description of selected factors
Today, we’re going to delve into two most trending factors: of this week „Price Position 5“ and „Variance 5“.
Price Position 5 – Gauging Relative Strength:
Price Position 5 is a technical indicator designed to assess the relative position of a financial instrument’s current price within a specified historical price range. It provides a measure of where the current price stands within a defined range of historical prices, which is crucial in the technical analysis of financial markets.
The calculation for Price Position 5 involves three key components:
- Current Close Price: This is the closing price of the financial instrument at the present moment.
- Rolling Minimum Low Price: The minimum (lowest) value of the “Low” prices within a rolling window of size 5 days preceding the current point in time.
- Rolling Maximum High Price: The maximum (highest) value of the “High” prices within the same rolling window of 5 days.
The formula for Price Position 5 is as follows: Price Position 5 = (Current Close Price – Rolling Minimum Low Price) / (Rolling Maximum High Price – Rolling Minimum Low Price). A Price Position of 0.5 signifies that the current price is in the middle of the historical range, while a Price Position close to 1 suggests that the current price is near the highest price observed within the 5-day window.
How can Price Position 5 be used for forecasting future prices?
- A Price Position significantly above 0.5 may indicate relative strength, suggesting that the current price is closer to the historical high within the specified time frame.
- Conversely, a Price Position significantly below 0.5 may indicate relative weakness, implying that the current price is closer to the historical low.
- Traders and analysts use Price Position 5 to assess trends, momentum, and potential support or resistance levels. It can be a valuable tool for making buy, sell, or hold decisions.
Variance 5 – Measuring Market Volatility:
Variance 5 is a statistical indicator used to measure the variability or dispersion of a financial instrument’s returns over a 5-day time horizon. It helps traders and investors understand the level of market volatility within this specific time frame.
The formula for Variance 5 is calculated as follows: Variance 5 = Sum of squared daily returns within the last 5 days / 5.
How can Variance 5 be used for forecasting future prices?
- High Variance 5 values indicate higher volatility, suggesting that the returns of the financial instrument have been more variable in the past 5 days.
- Low Variance 5 values indicate lower volatility, implying that returns have been relatively stable over the same time frame.
- Traders often use Variance 5 to assess risk and make informed decisions about their trading strategies. Higher volatility may lead to more significant price swings and potentially higher risk.