The AP on the Street 42nd week of 2023 – Trending Factors

The AP on the Street 42nd week of 2023 – Trending Factors
The second factor-driven weekly newsletter is here. Let’s look at the trending factors from last week (16.10.2023 – 23.10.2023). Read the e-mail version.
Trending factors from last week
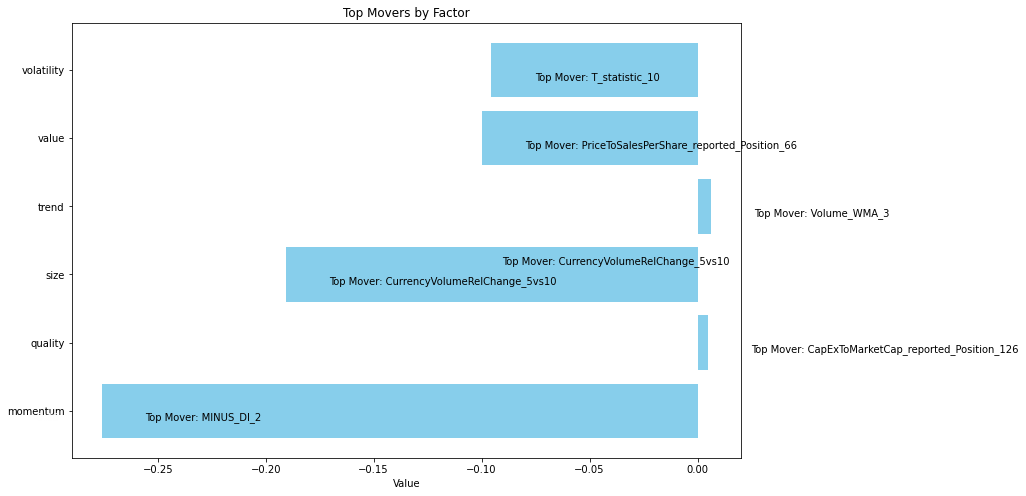
| Row | Factor group | Group total | Top mover within the factor group | Mover value |
| 0 | momentum | -0.27569164898741 | MINUS_DI_2 | +4.861885032051807 |
| 1 | quality | +0.00498774743113 | CapExToMarketCap_reported_Position_126 | +0.293621646290264 |
| 2 | size | -0.19055868581251 | CurrencyVolumeRelChange_5vs10 | -1.267878769475095 |
| 3 | trend | +0.00622771526394 | Volume_WMA_3 | +0.092155260802287 |
| 4 | value | -0.09985457800898 | PriceToSalesPerShare_reported_Position_66 | -0.591317251961362 |
| 5 | volatility | -0.09543393115559 | T_statistic_10 | -1.496955426328000 |
The table shows Trending Factors 16.10.2023 – 23.10.2023.
The exposure/impact of momentum factors on the price movement of all stocks from our basket(S&P 100) compared to last week decreased by 27% (-0.275691) from the original value (moreover the week before there was a decline of 22%). The MINUS DI 2 on the volume of trades rose by 486%. High and sustained values of “MINUS DI 2” may signal a strong downward trend, prompting traders to act accordingly (you can find more information in the section Description of selected factors).
Statistics for factors
| Row | Factor | T-Stat | P-Value | Direction |
| 0 | MINUS_DI_2 | 3.276323 | 0.000571 | +1.0 |
| 1 | CapExToMarketCap_reported_Position_126 | 0.226611 | 0.410420 | +1.0 |
| 2 | CurrencyVolumeRelChange_5vs10 | 1.587773 | 0.056561 | +1.0 |
| 3 | Volume_WMA_3 | 2.508517 | 0.006258 | +1.0 |
| 4 | PriceTpSalesPerShare_reported_Position_66 | 2.399384 | 0.008438 | -1.0 |
| 5 | T_statistics_10 | 2.923876 | 0.001826 | -1.0 |
The table shows Factor Statistics 1990 – 2023.
In the table, we can see the T-Stat and P-Value for the entire period of history for which we evaluate the factors, i.e. 1990 – 2023. The Direction value shows the direction in which the factor affects the movement of the share price, +1 expresses the positive impact of the increasing factor on the share price, and -1 expresses the negative impact of the increasing value of the factor on the share price.
| Row | Factor | T-Stat | P-Value | Direction |
| 0 | MINUS_DI_2 | 0.270594 | 0.393999 | +1.0 |
| 5 | T_statistics_10 | 1.423784 | 0.080863 | +1.0 |
The table shows Factor Statistics 2020 – 2023 for 2 most moving factors from the previous week
In the table for the last 3 years, we can see that the “T statistics 10” factor had the opposite effect on the share price than in the whole long-term history.
Description of selected factors
Today, we’re going to delve into two most trending factors: “MINUS DI 2” and “T statistic 10”.
When it comes to analyzing financial markets, having the right tools can make all the difference. In this article, we’ll explore two technical indicators that have been trending this week, “MINUS DI” and “T Statistic,” with their time horizons of two days and ten days, respectively, and see how they can help us understand price movements and market events.
MINUS DI 2 – Detecting Downward Trends:
“MINUS DI 2” is a technical indicator designed to identify downward trends in asset prices, particularly over a short two-day time frame.
- It calculates the difference between today’s low price and yesterday’s low price.
- A negative difference indicates a downward movement, increasing the value of “MINUS DI2 “.
- Traders use it to gauge the strength of a downward trend and consider their trading strategies accordingly.
It can be calculated as DI- = Smoothed (N) Negative Directional Movement / Smoothed (N) True Range. Where:
- DI- is the Negative Directional Indicator.
- Smoothed (N) Negative Directional Movement is the smoothed average of negative directional movements over a period of N.
- Smoothed (N) True Range is the smoothed average of true range values over a period of N.
The Negative Directional Movement (DM-) is calculated using the formula: Negative Directional Movement (DM-) = High of the previous period – High of the current period
The True Range is calculated as the maximum of the following three values:
- High of the current period – Low of the current period
- Absolute value of High of the current period – Close of the previous period
- Absolute value of Low of the current period – Close of the previous period
How can “MINUS DI 2” be used for forecasting future prices?
- High and sustained values of “MINUS DI 2” may signal a strong downward trend, prompting traders to act accordingly.
- A declining “MINUS DI 2” can suggest a potential trend reversal, urging traders to exercise caution.
In summary, “MINUS DI 2” is a valuable tool for short-term traders looking to capitalize on downward price movements.
T-Statistics 10 – Analyzing Market Events:
- The T-statistic is a statistical measure that quantifies how far the mean return of an investment or asset is from zero in terms of standard deviations.
- It is commonly used in financial analysis to determine whether the average return is statistically different from zero, aiding in investment decision-making.
- A higher absolute value of the T-statistic indicates a more significant deviation from zero and potentially a more noteworthy result.
- In our case, the T-Statistic had a time horizon of 10 days
The formula for T-Statistic 10:
- t = mean returns/volatility / √10 (time horizon)
Example: Imagine analyzing two investment strategies:
- Strategy A has an average annual return of 10%, with a standard deviation (volatility) of 5%, and a 10-day time horizon.
- Strategy B has an average annual return of 8%, with a standard deviation of 5%, and the same time horizon.
For Strategy A:
- t = 10% (mean returns) / 5% (volatility) / √10 (time horizon) ≈ 0.2
For Strategy B:
- t = 8% (mean returns) / 5% (volatility) / √10 (time horizon) ≈ 0.16
In this example, Strategy A’s T-Statistic 10 (0.2) is higher than Strategy B’s (0.16), indicating a more statistically significant difference from zero and potentially a better choice in terms of risk-adjusted returns when considering a 10-day time horizon.
How can T-Statistic 10 be used for forecasting future prices?
- Used to assess whether an investment strategy, asset, or portfolio’s returns are statistically significant or due to random chance.