Are Higher Earnings Always Better? Case Study from S&P 100

Are Higher Earnings Always Better? Case Study from S&P 100
Today, we will examine data from the S&P 100 market to understand the behavior of Earnings Per Share (EPS). While many investors regard a high EPS as indicative of a successful company, our data suggests that the reality is more complex. Let’s delve into the performance of factor-mimicking portfolios for S&P 100 companies from 1990 to 2020.
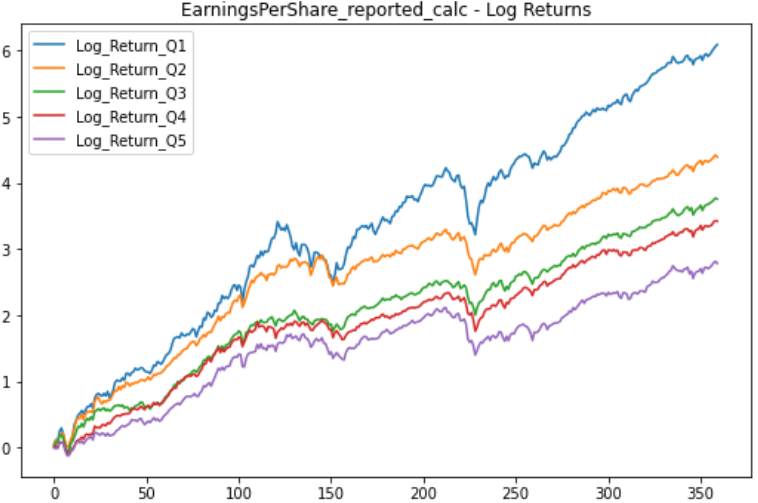
The lowest quantile portfolio (Q1) consists of 20 companies with the lowest EPS, while the highest quantile portfolio (Q5) comprises 20 companies with the highest EPS. Surprisingly, the Q1 portfolio outperformed the Q5 portfolio. A T-test confirms the statistical significance of this finding, with a p-value very close to zero (4.193015e-03), challenging the conventional wisdom that a higher EPS is always better.
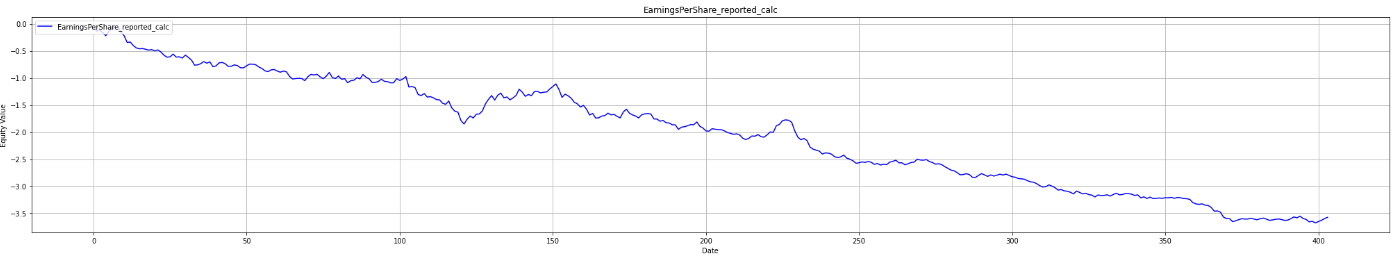
The following graph shows cumulative differences between portfolios Q5 and Q1 which can be called a long-short portfolio equity curve.
But what are the reasons for this counterintuitive behavior? Here is one potential explanation.
Current vs. Future Conditions
Earnings per Share captures the immediate performance of a company, but markets often price in future returns as well. Consider Toyota and Tesla: although Toyota produces more vehicles, Tesla’s market capitalization ($790 billion USD vs. $290 million USD) dramatically favors the U.S. car producer. This suggests that the market is pricing in Tesla’s future growth prospects while accounting for Toyota’s challenges in adapting to the automotive future.
Patterns Hidden in Data
Another explanation could be unobserved phenomena that correlate with current good results but have negative implications for future performance. High Earnings per Share often characterize mature companies with well-established businesses. While such companies offer stability, their growth potential is limited.
Earning Per Share as a Risk Factor
Viewing EPS through a different lens, let’s think of it as a risk indicator with an inverse relationship to risk—the higher the EPS, the lower the investment risk. This perspective neatly aligns with our findings: investors seem to be rewarded with greater returns when they take on the inherent risk of companies with lower EPS. In simpler terms, the riskier the investment, the higher the potential for exceptional returns.
Compensation for Risk is not a Sure Bet
Our data-driven analysis of S&P 100 companies provides a compelling narrative, but it’s important to address a common misconception: higher risk doesn’t automatically yield higher returns. While financial theory posits that greater risks should be accompanied by the potential for greater returns, the keyword here is “potential.” This signifies that, although you’re positioned for higher returns, they’re not guaranteed. This subtle point emphasizes that there were times when taking calculated risks was definitely more rewarding.
The article is part of the series focusing on Factor investing. Take a look at the previous article In Factor Investing Even the Best Can Lose – Data-Driven Insights into Factor-Based Analysis. Contact us for more information or try the Analytical Platform application which orders the stocks according to the factor investment theory.