The AP on the Street 41st week of 2023 – Trending Factors

The AP on the Street 41st week of 2023 – Trending Factors
The first factor-driven weekly newsletter is here. Let’s look at the trending factors from last week (09.10.2023 – 13.10.2023). Read the e-mail version.
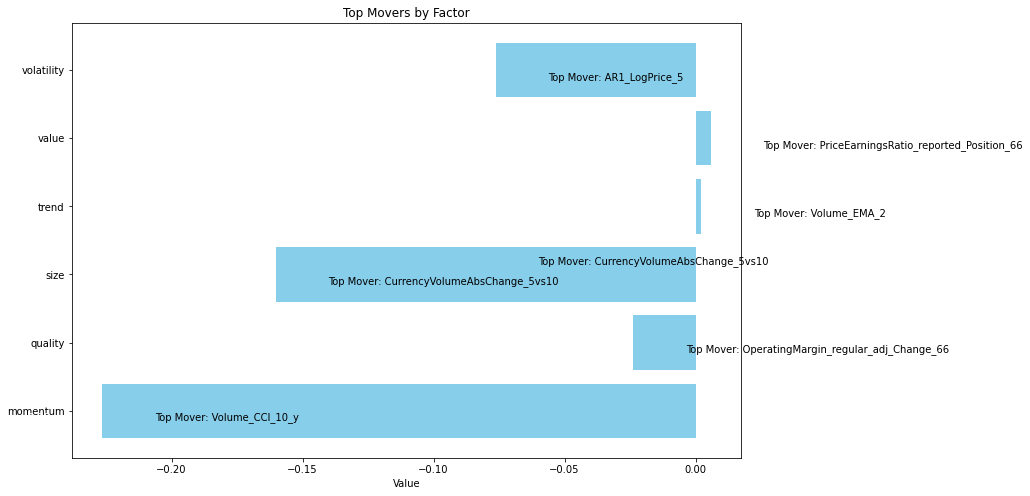
Trending factors from last week
| Row | Factor Group | Value | Top Mover | Mover Value |
| 0 | momentum | -0.226427 | Volume_CCI_10_y | -1.781606 |
| 1 | quality | -0.023770 | OperatingMargin_regular_adj_Change_66 | -0.637422 |
| 2 | size | -0.160261 | CurrencyVolumeAbsChange_5vs10 | -1.193015 |
| 3 | trend | +0.002167 | Volume_EMA_2 | +0.085381 |
| 4 | value | +0.005852 | PriceEarningRatio_reported_position_66 | +0.227265 |
| 5 | volatility | -0.076211 | AR1_LogPrice_5 | -1.407046 |
The table shows Trending Factors 09.10.2023 – 13.10.2023.
The exposure/impact of momentum factors on the price movement of all stocks from our basket(S&P 100) compared to last week decreased by 22% (-0.226427) from the original value. The 10-day CCI on the volume of trades fell by 178%, i.e. from positive to negative values. This indicator confirms other data that point to a noticeable outflow of money from the S&P 100 market (but very likely also from broader indices).
Statistics for factors
| Row | Factor | T-Stat | P-Value | Direction |
| 0 | Volume_CCI_10_y | 0.591403 | 0.277291 | 1.0 |
| 1 | OperatingMargin_regular_adj_Change_66 | 0.282352 | 0.388909 | 1.0 |
| 2 | CurrencyVolumeAbsChange_5vs10 | 1.293257 | 0.098332 | 1.0 |
| 3 | Volume_EMA_2 | 2.432616 | 0.007712 | 1.0 |
| 4 | PriceEarningRatio_reported_position_66 | 1.905585 | 0.028708 | -1.0 |
| 5 | AR1_LogPrice_5 | 0.525041 | 0.299922 | 1.0 |
The table shows Factor Statistics 1990 – 2023.
In the table, we can see the T-Stat and P-Value for the entire period of history for which we evaluate the factors, i.e. 1990 – 2023. The Direction value shows the direction in which the factor affects the movement of the share price, +1 expresses the positive impact of the increasing factor on the share price, and -1 expresses the negative impact of the increasing value of the factor on the share price.
| Row | Factor | T-Stat | P-Value | Direction |
| 0 | Volume_CCI_10_y | 0.003202 | 0.498730 | 1.0 |
| 1 | OperatingMargin_regular_adj_Change_66 | 0.831659 | 0.205098 | 1.0 |
| 2 | CurrencyVolumeAbsChange_5vs10 | 0.981928 | 0.165814 | 1.0 |
| 3 | Volume_EMA_2 | 0.529019 | 0.299756 | 1.0 |
| 4 | PriceEarningRatio_reported_position_66 | 0.184336 | 0.427308 | -1.0 |
| 5 | AR1_LogPrice_5 | 0.233556 | 0.408219 | -1.0 |
The table shows Factor Statistics 2020 – 2023.
In the table for the last 3 years, we can see that the AR1 LogPrice 5 factor had the opposite effect on the share price than in the whole long-term history.
Description of selected factors
Today, we’re going to delve into two most trending factors: “AR1 LogPrice 5” and “Volume CCI 10 y”.
AR1 LogPrice 5
“AR1 LogPrice 5” is a statistical metric designed to assess the relationship between past and current prices of a financial asset using an AutoRegressive (AR) model. An AR model is a time series forecasting technique that works on the principle that the current value of a variable can be predicted using its past values. In the case of “AR1 LogPrice 5,” it helps us understand the extent to which previous prices influence the asset’s present value.
This metric quantifies the degree of interdependence between these temporal data points with a 5-day interval, enabling us to make predictive inferences about future price trends based on historical patterns. It is invaluable for discerning trends and patterns, providing insights that are highly relevant for making well-informed decisions in financial analysis and beyond.
Volume CCI 10 y
The next metric is “Volume CCI 10 y”. Here, we have used the financial analysis tool known as the Commodity Channel Index (CCI) to understand how trading volume has behaved in the past 10 days. CCI is a technical analysis indicator that measures the variation of an asset’s price from its statistical mean. It helps identify overbought or oversold conditions in a market, providing insights into potential price reversals.
How can we use “Volume CCI 10 y” to forecast future prices? While CCI itself doesn’t directly predict future prices, it can help us understand market sentiment. For instance, if “Volume CCI 10 y” is very positive, it might indicate a bullish sentiment, suggesting that the price may continue to rise. If it’s very negative, it may indicate a significant sell-off, which could predict a downward trend in the price of the stock. However, the impact can vary during the different time frames. For better understanding read our article Are Higher Earnings Always Better? Case Study from S&P 100.
Read more about the newsletter concept and the complexities of factor investing and data-driven insights which help to make more informed investment choices.
Contact us for more information or try the Analytical Platform application which orders the stocks according to the factor investing theory.