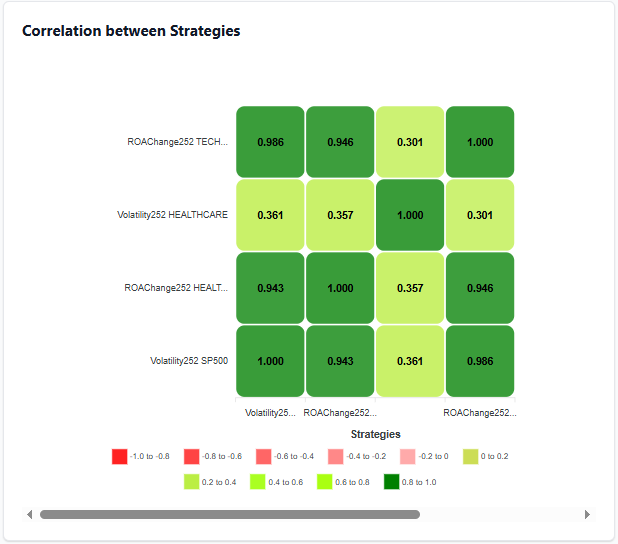
Why Different Factors Often Pick the Same Stocks
Factor signals overlap, correlate, and sometimes capture very similar underlying behavior despite being built differently.
March delivered one of the clearest examples of factor performance rotation we’ve seen in a while. February performance was a negative predictor of March performance. In other words, what worked best in February was systematically punished just one month later.… Read More »When Last Month’s Winners Stop Working
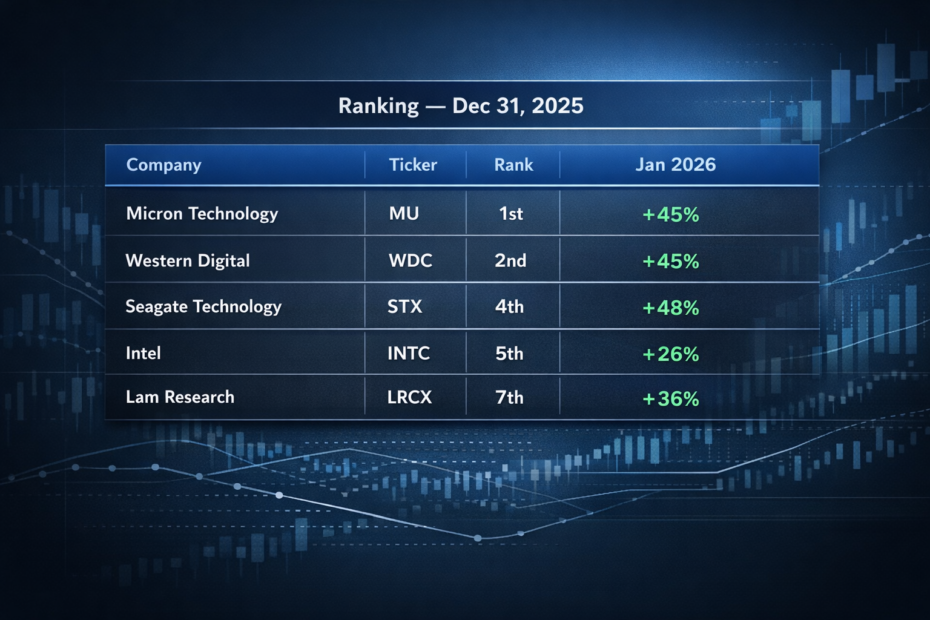
Before the move, the top-performing stocks were ranked at the very top of the PLUS DI 252 indicator across the S&P 500 universe.
With the start of the new year, we are proud to officially introduce Analytical Platform 2.0, the latest evolution of our investment analytics platform designed for data-driven investors, analysts, and portfolio managers.
The end of 2025 is the ideal time to look at what really worked on the market—and, more importantly, why, as the interpretation of individual metrics can be very misleading.
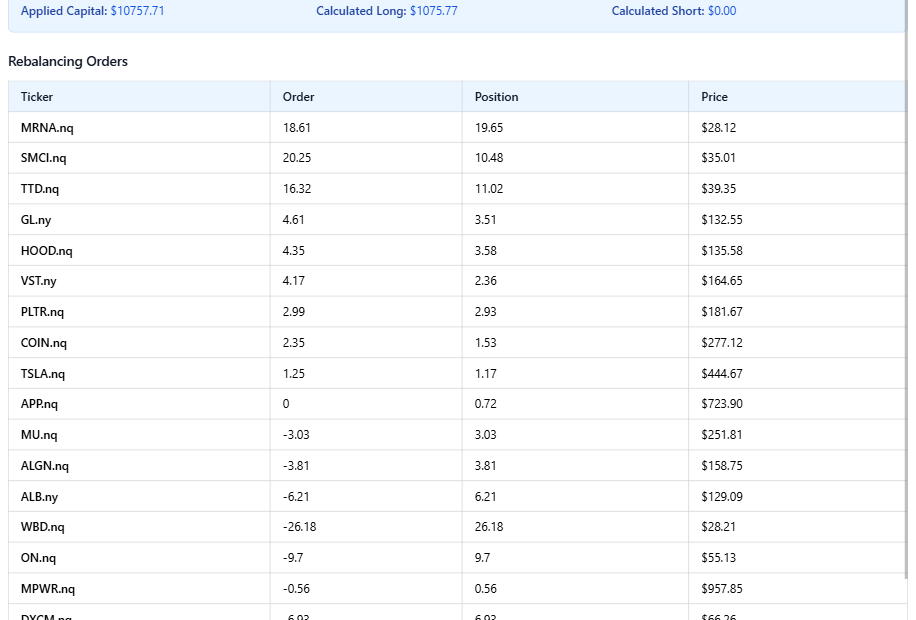
This document explains how the AP’s Rebalancing App works. It is designed for semi-automatic portfolio adjustments based on AP strategies.
The document describes how we collect articles about financial markets published by online media and how we analyze them.
This documentation explains how the application works, how strategies are structured, and how individual screens interact.
This document outlines how we handle universes, data, survivor ship bias, dividends, and monthly strategy execution.
How significant is survivorship bias? In this article, you get the answer. Pay close attention to the investment methodology.