Using Alpha, Beta, and Sharpe Ratio for Configuration of Investment Strategies

Using Alpha, Beta, and Sharpe Ratio for Configuration of Investment Strategies
The article, part of our “Configuration of Investment Strategies” series, introduces the concepts of stock investment indicators and ratios. Alpha indicator, Beta indicator, and Sharpe ratio are applied within our StockPicker configurator. We’ve introduced a simple table that quickly summarizes the performance and stability of each strategy. Making it easy to understand their long-term gains and volatility. These metrics are among the most widely used for evaluating the quality of investment strategies.
Let’s first talk about what Alpha, Beta, and Sharpe are individually and what they are.
Alpha indicator (α)
- Alpha measures the excess return of an investment or portfolio compared to a benchmark (like an index or market average).
- Positive alpha suggests that the investment or portfolio has outperformed the benchmark, while negative alpha indicates underperformance.
- In simple terms, the alpha indicator helps you assess whether an investment manager is adding value beyond what you could have achieved by simply investing in the benchmark.
- The way we calculate it: Alpha is calculated as the difference between the actual return of the investment or portfolio and the return that would be expected based on its beta (market sensitivity) and the risk-free rate. The formula for alpha is as follows:
Alpha=Actual Return−(Risk-Free Rate+Beta×(Market Return−Risk-Free Rate))
The risk-free rate of the current period is downloaded thanks to the FRED API.
Beta indicator (β)
- Beta is a measure of an investment’s sensitivity to market movements, particularly in relation to a benchmark index like the S&P 500.
- A beta of 1 means the investment tends to move in line with the market. A beta greater than 1 implies it’s more volatile, while a beta less than 1 suggests lower volatility compared to the market.
- In simple terms, the beta indicator helps you understand how much investment is likely to go up or down in response to market fluctuations. A higher beta means more risk.
- The way we calculate it: Beta is calculated by analyzing the historical price movements of the investment in relation to the benchmark index. It is determined through linear regression, where the slope of the regression line represents the beta value. The formula for beta is as follows:
Beta=Covariance between Investment Returns and Benchmark Returns/The Variance of Benchmark Returns
Sharpe Ratio
- The Sharpe Ratio is a measure of risk-adjusted return. It evaluates how much return an investment or portfolio generates relative to its risk (usually measured as volatility or standard deviation).
- A higher Sharpe Ratio indicates better risk-adjusted performance, as it means the investment is providing more return for each unit of risk taken.
- In simple terms, the Sharpe Ratio helps you assess whether the return you’re getting from an investment is worth the level of risk you’re taking.
- The way we calculate it: The Sharpe Ratio is calculated by subtracting the risk-free rate of return from the average return of the investment or portfolio and then dividing the result by the standard deviation of those returns. The formula for the Sharpe Ratio is as follows:
Sharpe Ratio=(Average Return−Risk-Free Rate)/Standard Deviation of Returns
In summary
- Alpha indicator evaluates an investment’s performance compared to a benchmark.
- The beta indicator measures its sensitivity to market movements.
- Sharpe Ratio assesses its risk-adjusted return.
Now let’s analyze the Alpha, Beta, and Sharpe ratio of the example strategies being used in this series of articles. More info on how they are created and what is their goal here.
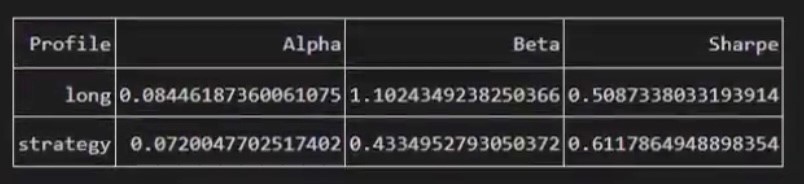
Long Strategy (Often referred to as “Aggressive”)
- Alpha = 0.08: The Long Strategy has delivered a positive alpha of 0.08. This indicates that the aggressive approach has outperformed the benchmark. It’s a promising sign, suggesting the strategy adds value beyond what the market provides.
- Beta = 1.1: The beta for the Long Strategy is 1.1, meaning it’s slightly more volatile than the market on average.
- Sharpe = 0.5: With a Sharpe ratio of 0.5, the Long Strategy offers a moderate level of risk-adjusted return.
Strategy (Often referred to as “Long Short”)
- Alpha = 0.07: The Long Short Strategy has also performed well with a positive alpha of 0.07. This suggests that the Long Short approach has outperformed its benchmark with a little bit less than the “Long strategy” did. This is expected since this strategy is more conservative.
- Beta = 0.43: The beta for the Long Short Strategy is 0.43, indicating that it’s less volatile and less risky compared to the market, delivering confidence and stability to the investor.
- Sharpe = 0.61: The Sharpe ratio for the Long Short Strategy is 0.61, showing that it offers a better risk-adjusted return compared to the Long Strategy.
In this example, we presented how Alpha, Beta, and Sharpe indicators can be used for evaluating investment strategies. In conclusion, both of the considered investment strategies have delivered positive alphas, indicating they’ve outperformed their respective benchmarks. The Long Strategy is riskier and more closely tied to market movements but it has higher returns. The Long Short Strategy provides a better risk-adjusted return with lower volatility.
Contact us and use Strategies Configurator for building and evaluating your investment strategies.