Configuration of investment strategies

Configuration of investment strategies
There are 3 things crucial for building stock investment strategies.
- Develop a quality model that can rank stocks from most undervalued to most overvalued (the AP Model training module is used for this purpose).
- Configure (backtest) the strategy using the developed model so that it best meets the needs of the analyst/portfolio manager (AP Strategy Configurator module).
- Run the strategy on real accounts so that it can then be provided to clients (the AP Rebalancing module that allows creating orders for Interactive Brokers).
We will show the approach in a specific example, where we take the S&P 100 stock index as a benchmark. For configuration purposes, we divide the index into 5 quantiles. Q5 represents the 20 most undervalued stocks, and Q1 the 20 most overvalued stocks.
Our goal is to achieve higher performances and lower dips than the benchmark, we will leave the specific values open for a sample example.
Model development and strategy configuration need to be aligned with each other, as configuration results will be different for each model.
- For example, an analyst creates model 1 which achieves great CAGR values for the quantile of the most undervalued stocks, but the model does not achieve very good values for the quantile of the most overvalued stocks, in other words, Q1 stocks grow faster than Q3 and Q4 stocks over the long time series. The model is good for valuing undervalued stocks.
- Conversely, in Model 2, the CAGR of the most undervalued quantile reaches lower values than in Model 1, but the stocks from the most undervalued quantile grow significantly slower and the results are more stable. The model is good for valuing overvalued stocks.
If the analyst wants to build a Long/Short portfolio, i.e. a portfolio with a leverage of 1.5, where 60% of the exposure is in Long positions and 40% in Short positions, he will achieve significantly different results when using the mentioned models.
In today’s article, we will show how our investment strategy configuration tool can be used and what metrics it offers.
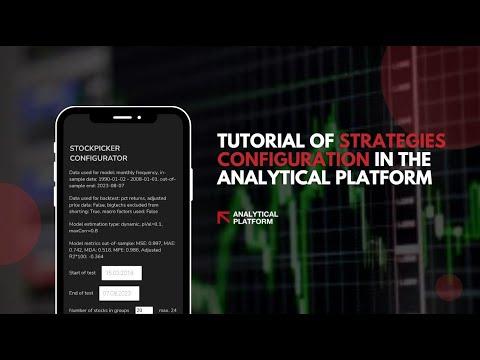
In the first step, we set the input parameters.
- Test period.
- Number of stocks in each quantile. For example, if we select only 3 stocks, on the S&P 100 index, the system will select stocks with the highest score value (1st-3rd place) in Q5, 98th to 100th stocks in Q1, and 49th to 51th stocks in Q3 quantile.
- Frequency of portfolio adjustment (day, week, month, quarter, or year).
- Initial capital value.
- Additional capital invested with each portfolio adjustment.
- Exposure of long/short positions, i.e. what percentage we invest in long positions and how much in short positions.
- The weight of individual shares. If we choose “Equal-weighted”, the listed shares will be bought at 33.33% each, if “Score-weighted”, each share will be represented according to the value of the score it achieved (into the most undervalued share in the 1st place will be invested more than to the share in 3rd place).
Results achieved
After clicking the Backtest button, the system calculates metrics to support the investment decision-making process. It always compares the values of Long positions (Aggressive Strategy), Portfolio (Long/Short strategy), and benchmarks.
- Equities of Strategy and Benchmarks
- Strategies‘ Drawdown
- Alpha, Beta, Sharpe
- Stock Group Equities
- Stock Group Performance
- CAGR
- Standard deviation
- Equity
- Equity with investing
- RoMaD Equity
- Maximum Drawdown Percentage
- Longest Drawdown in Days
- Maximum Drawdown Money
- CAGR for longer horizons
- Rebalances performance
- Distribution of rebalance returns
- Rebalances results – rolling window performance, win. Length
- Value at Risk, Max performance, Min Performance a Negative return occurrence
- Categorical evaluation of rebalance
- Rebalances Absolute Error
- Quantile confusion matrix
- Next rebalance score decomposition (Features Contribution)
The strategy configuration tool offers a large number of metrics, indicators, and graphs that help analysts build a strategy according to their needs through initial parameterization. In the next articles, we will present in more detail the individual indicators and how they are used, as well as the procedure for training the models that are used in the strategy configurator.
We are currently working on a back tester, which is built on the aforementioned configurator and is also directly connected to the AP Model Training Module. We would love to include you among our test users and hear your feedback and needs for effectively building and managing investment strategies.