Equities of strategy and benchmarks

Equities of strategy and benchmarks
The article from the series “Configuration of Investment Strategies” presents the Equities of Strategy and Benchmarks indicator that we use in the StockPicker configurator.
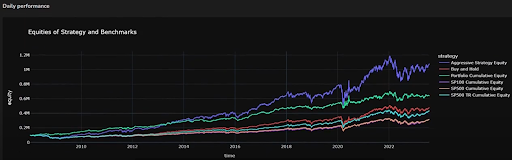

The graph shows us the development of the portfolio value over time according to the previously entered input data. In the presented case, there is a portfolio tested from 01/01/2008 to 07/31/2023 selecting shares from the S&P 100 index*, rebalanced once a month. The initial value of the capital is 100,000 and the Shares are weighted in the portfolio according to the value of the obtained score, i.e. the share with a higher value has a higher quantity in the portfolio. The main tested strategy holds 60% of Long positions and 40% of Short positions in the portfolio, at the same time it uses a leverage of 1.5.
Aggressive Strategy Equity shows how a portfolio of the 20 most undervalued stocks performed over a given interval.
Buy and Hold shows how a portfolio composed of the stocks we have in our stock basket to date has performed (*95% tracks the current S&P 100 index). These are stocks for which we have long-term data. Compared to the benchmark, in the basket, there is included, for example, the OXY share. Conversely, TSLA is missing.
The Cumulative Equity Portfolio shows the capital value of the flagship tested strategy.
SP100 Cumulative Equity presents the values of the S&P 100 index.
SP500 Cumulative Equity shows the values of the S&P 500 index.
SP500 TR Cumulative Equity presents the values of the S&P 500 index including dividends paid.
The user can also see the final values in the Equity table, which is part of the table section of the configurator. However, the values are clearly visible from the graph and it can be seen that from the point of view of the final value of the capital, the Aggressive strategy works best, followed by the main strategy consisting of Long I short positions and using leverage.
The Buy and Hold “strategy” came in third place, because logically stocks that grew the most during the given period are included in the current index of the largest companies (S&P 100). When creating a test, the configurator selects from these shares. In the case of Long positions, it is therefore fair to compare the results of strategies with Buy and Hold. On the other hand, in the case of Short positions, the configurator achieves worse values than would actually occur, as it only selects from the most-growing companies for the given period.
As expected, the benchmark in the form of the S&P 500 index, including paid dividends, took the next place. It is appropriate to add here that the Analytical Platform strategies are at a disadvantage compared to this benchmark in the configurator. Because in real trading operations, AP strategies also receive (or payout in the case of short positions) dividends. The S&P 500 and 100 indices (dividends not included) achieved the lowest performance.
Both strategies using the investment model deployed in the configurator beat the benchmark. In the next article, we are going to introduce the indicators related to Drawdown, i.e. the maximum dips in the portfolio and the length of these declines.
We would love to include you among our test users and hear your feedback and needs for effectively building and managing investment strategies.