Trending Factors for AI-powered stock analysis (TAOTS 3rd Month of 2024)

Trending Factors for AI-powered stock analysis (TAOTS 3rd Month of 2024)
Greeting investors! Welcome to our Newsletter, in which we look at the Trending Factors from the third month of 2024. Factors are the building blocks for AI-powered stock market analysis, stock picking, and the creation of robust investment strategies.
Introduction
We are focusing on the performance of six key factors including Momentum, Quality, Size, Trend, Value, and Volatility that influence the stock market. Our goal is to provide a comprehensive guide that will allow you to make informed investment decisions. Read more about our 6-Factor (Groups) Investment Model.
Trending factors from last month
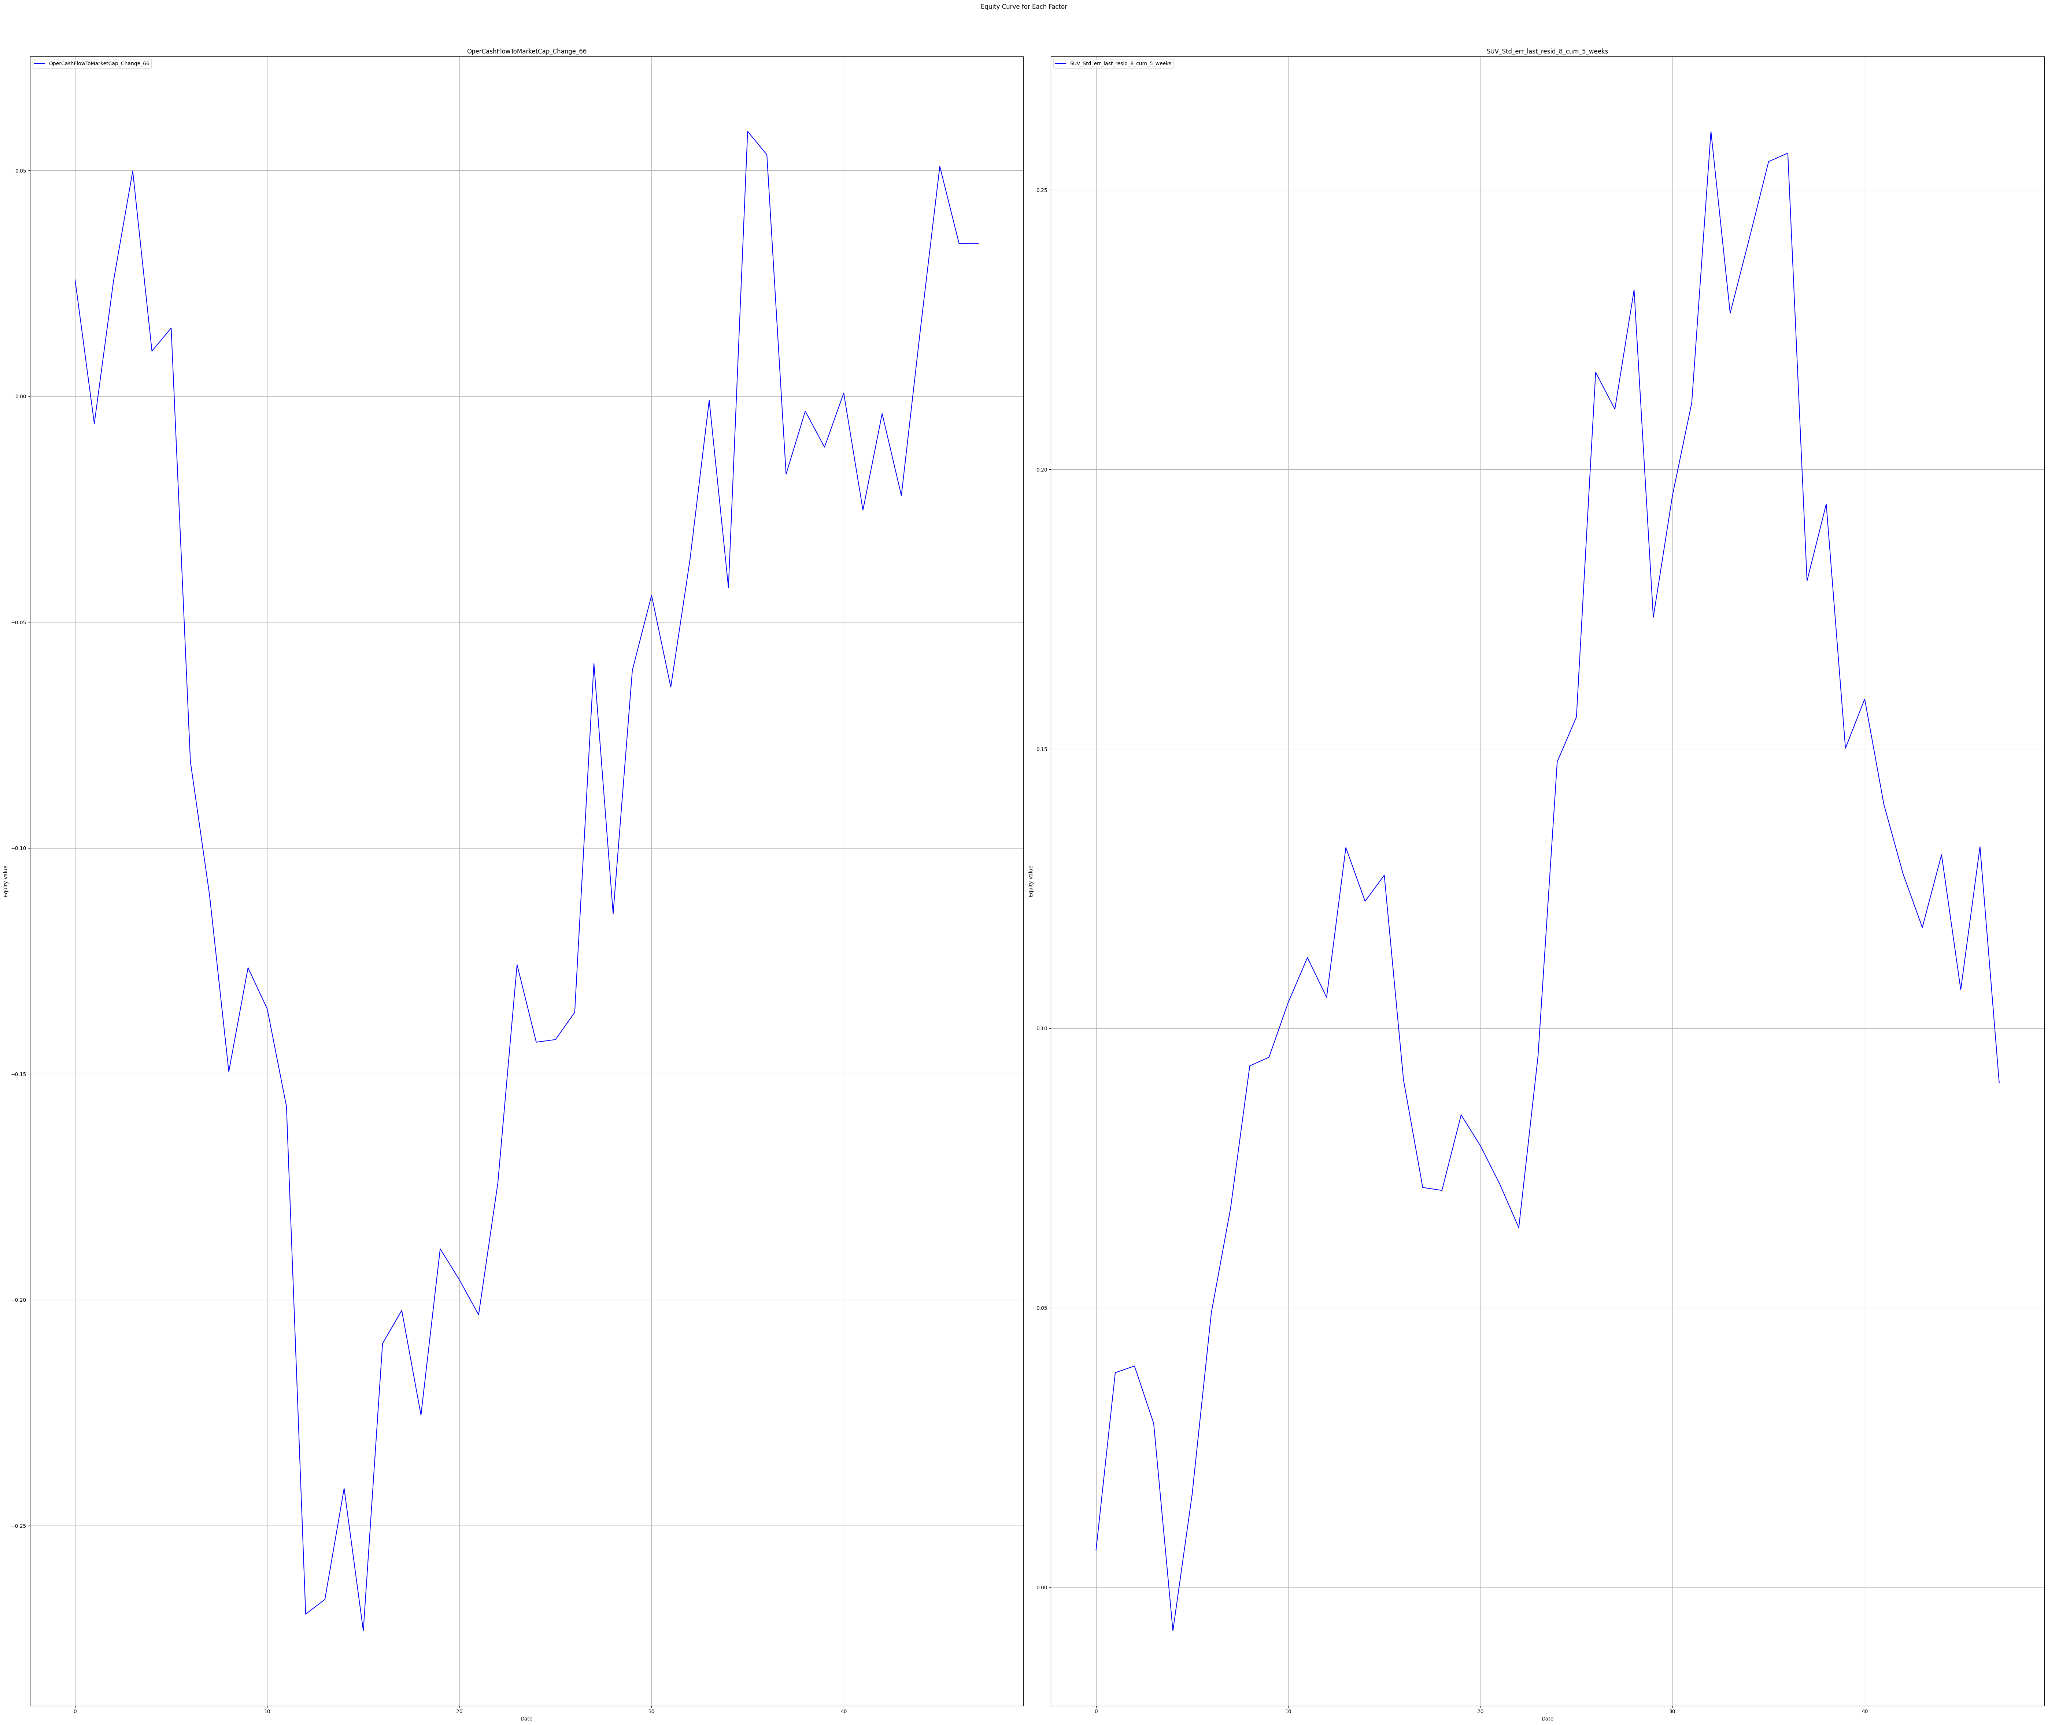
The two most significant factors for March 2024 were SUV Std err last resid 8 under the Momentum category, and OperCashFlowToMarketCap_Change_66 under the Quality factor group (following up on OperCashFlowToMarketCap_Position_66 from the previous month).
In March 2024, we saw (just like last month) a significant decrease in momentum represented by a -43.47% change – with SUV Std err last resid 8 cum 5 weeks dropping by a whopping -536.15%. As for the quality factor, we sighted a decline of -8.44% alongside OperCashFlowToMarketCap Change 66 dropping by – 104.50%. This provides a glimpse into the market’s direction, hinting towards decreased investor confidence or, potentially, indicative of a broader market trend.
Description of selected factors
SUV Std err last resid 8 cum 5 weeks (Momentum group of factors)
This sophisticated metric measures the standard error of the residuals from a regression predicting the upcoming 8-week returns using the trailing 5-week returns. The residuals can be a measure of unpredictability or market surprise which can reflect a company’s financial health.
OperCashFlowToMarketCap Change 66 (Quality group of factors)
This is a ratio of the company’s operating cash flow to its market capitalization, which provides insights into a company’s operational efficiency and financial structuring. This factor reflects whether the recent changes in a company’s cash flow are priced into its market value.
Is it worth selecting stocks for your portfolio based on these factors? We will find out in our analysis.
Factor Statistics 01.03.2024 – 31.03.2024
| Top mover factor within the factor group | Mover value | Factor group | Group total value |
|---|---|---|---|
| SUV_Std_err_last_resid_8_cum_5_weeks | -5.3615 | momentum | -0.4347 |
| OperCashFlowToMarketCap_Change_66 | -1.0450 | quality | -0.0843 |
| CurrencyVolumeAbsChange_5vs22 | -1.4395 | size | -0.3668 |
| Volume_WMA_10 | -0.1458 | trend | -0.0128 |
| PriceCashFlowRatio_Change_66 | -1.0049 | value | -0.1594 |
| Skewness_10 | -1.7839 | volatility | -0.1990 |
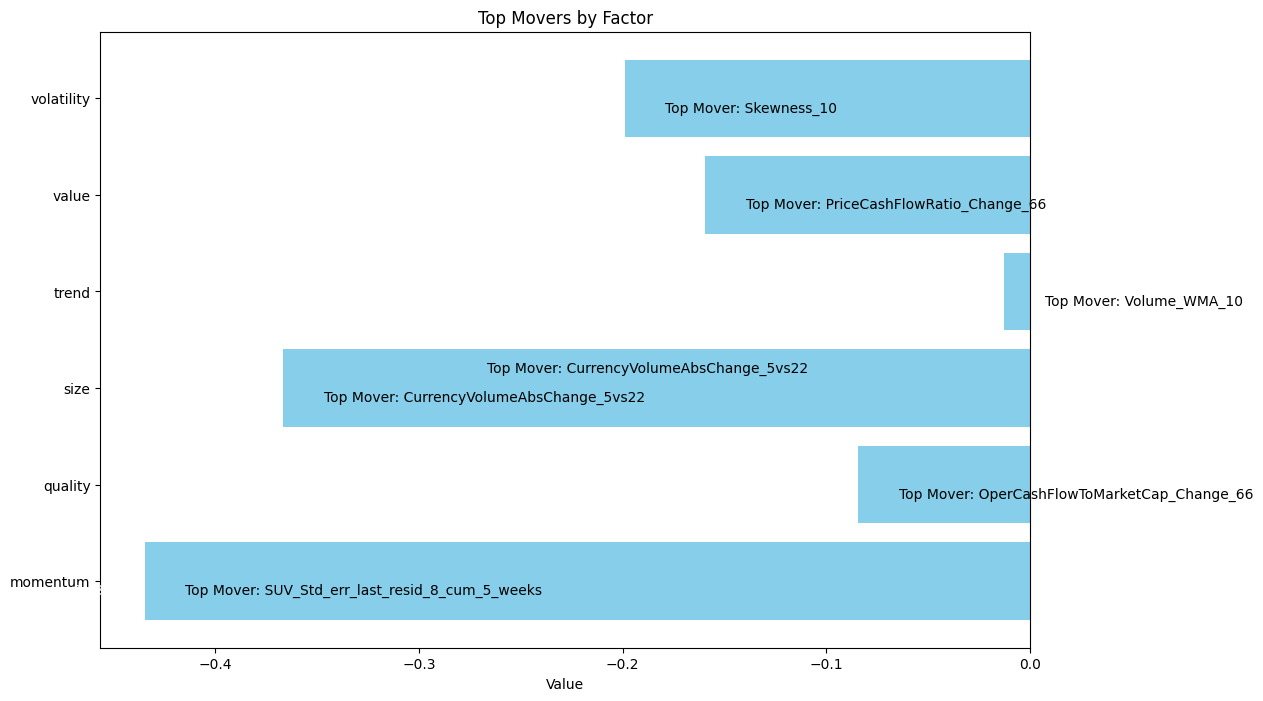
The figure shows the Top Movers across all the groups of factors we use in our analytics.
Let’s take a look at how traders who believed in the two most trending factors have fared in recent years
Statistics for factors
Factor Statistics 1990 – 2024
| Top mover factor within the factor group | T-Stat | P-Value | Direction |
|---|---|---|---|
| SUV_Std_err_last_resid_8_cum_5_weeks | +1.0060 | +0.1577 | -1.0 |
| OperCashFlowToMarketCap_Change_66 | +0.3176 | +0.3755 | -1.0 |
| CurrencyVolumeAbsChange_5vs22 | +2.0551 | +0.0205 | +1.0 |
| Volume_WMA_10 | +0.9311 | +0.1763 | +1.0 |
| PriceCashFlowRatio_Change_66 | +0.0572 | +0.4771 | -1.0 |
| Skewness_10 | +0.2444 | +0.4035 | +1.0 |
In the table, we can see the T-Stat and P-Value for the entire period of history for which we evaluate the factors, i.e. 1990 – 2024. The Direction value shows the direction in which the factor affects the movement of the share price, +1 expresses the positive impact of the increasing factor on the share price, and -1 expresses the negative impact of the increasing value of the factor on the share price. In simple terms of theory, we can say that a T-statistic that is greater than 2.0 or less than -2.0 is statistically significant; and if the P-value is less than 0.05, we reject the null hypothesis and say that we found a statistically significant effect.
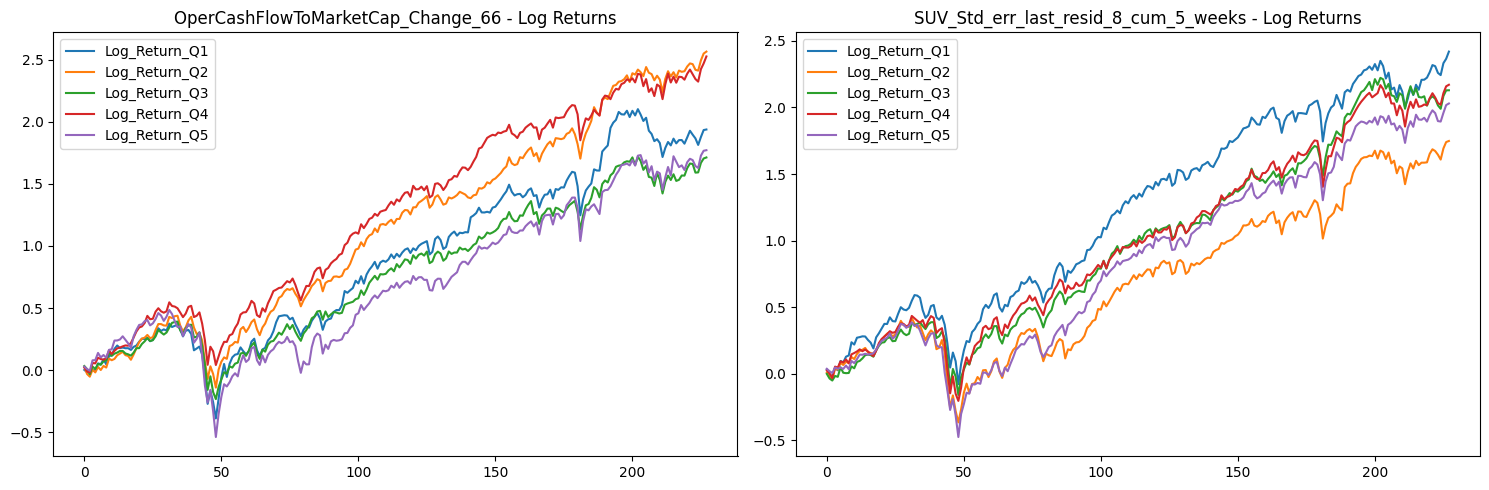
To understand the performance of these factors, we delve into their long-only portfolios based on quantiles, and long-short portfolio returns. The five quantiles (Q1-Q5) divide the data into equal parts according to the respective factor value, creating a picture of distribution across the portfolios. Investors usually target Q1 or Q5 portfolios of a factor, depending on whether the higher or lower value of the factor is expected to outperform.
The charts below show Factor Statistics 1990 – 2024 for the 2 selected factors from the previous month.
While the next one shows the behavior of the factors in the last 4 years.
Factor Statistics 2020 – 2024
| Top mover factor within the factor group | T-Stat | P-Value | Direction |
|---|---|---|---|
| SUV_Std_err_last_resid_8_cum_5_weeks | +0.4711 | +0.3198 | +1.0 |
| OperCashFlowToMarketCap_Change_66 | +0.1201 | +0.4524 | +1.0 |
| CurrencyVolumeAbsChange_5vs22 | +0.4387 | +0.3314 | +1.0 |
| Volume_WMA_10 | +0.5898 | +0.2790 | +1.0 |
| PriceCashFlowRatio_Change_66 | +0.2393 | +0.4059 | +1.0 |
| Skewness_10 | +2.0343 | +0.0237 | +1.0 |
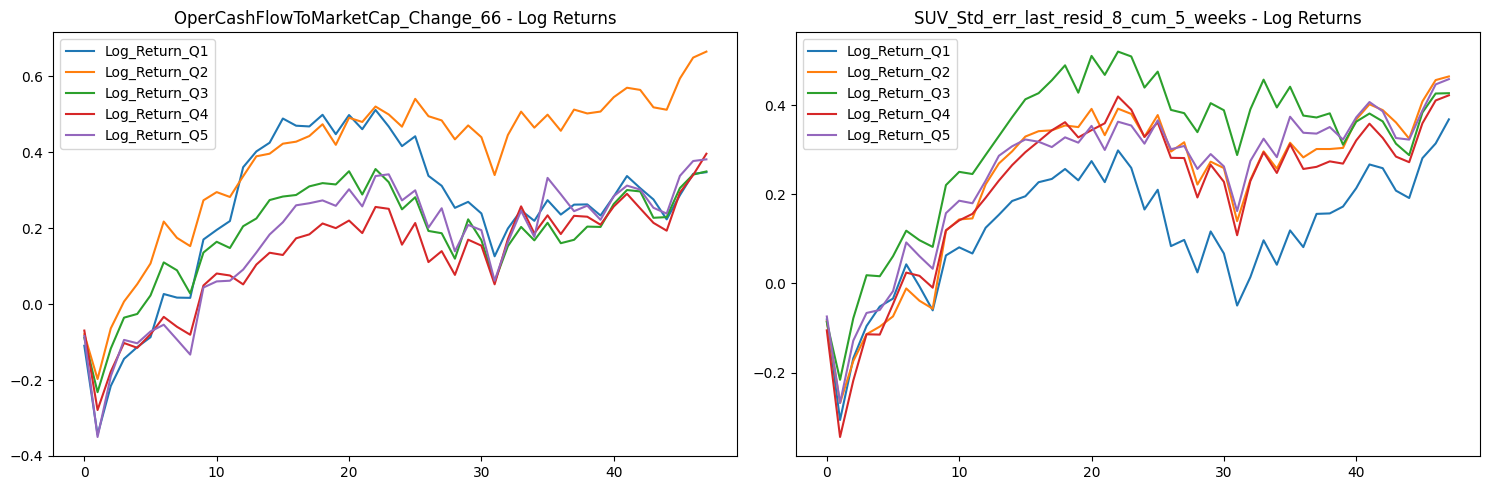
The charts below show Factor Statistics 2020 – 2024 for the 2 selected factors from the previous month.
Factor Statistics Insights
The data show us that in 2020-2024, the factors under consideration work exactly the opposite of the long-term history.
For example, stocks with the worst values for the Quality factor achieved higher appreciation than those with the best values on the time series from 1990 to 2024 (Q5-Q1 in the Factor Statistics 1990-2024 table show negative values, so ‘Direction’ is negative). Conversely, the stocks with the best values for the factor have performed better in 2020-2024.
This insight is also supported by our results for P-Value and T-Stat. Thus, the only statistically significant factor is CurrencyVolumeAbsChange_5vs22, which achieves good quality values for the above-mentioned indicators and also maintained a long-term Direction in the 2020-2024 time period. If you want to know this factor in more detail, try our Factor Investing App.
Do you want to invest in statistically significant factors that work over the long term? Try our Factor Investing app.
Invest in the forces that move stock prices
Leverage the power of factor investing with revolutionary software
Using factors in AI Stock Analysis
Our AI-powered StockPicking Lab is built on the factor investing approach combined with machine learning. We say that the most effective way to use AI to find the most undervalued stocks is to look for factors that influence stock price movements before matching appropriate stocks to them.
- In the first step, we focus on understanding the relationship between the high/low value of the factor under study for the stocks under consideration and the price movement of these stocks.
- Subsequently, we evaluate statistical significance using the P-value and T-statistic to select only the significant factors that we use to build the stock valuation model. There is no AI involved so far. However, this step already eliminates the basic problem of analysts evaluating stocks based on statistically insignificant factors and indicators.
These two points are the focus of our regular TAOTS. - In the next step, we can stack (ideally uncorrelated) factors into our model. This is where AI-based stock analysis comes in, as machine learning and its state-of-the-art methods should be used to select the best-performing uncorrelated factors and build robust stock strategies that work in most market situations. These investment strategies are what the StockPicking Lab provides. Read more in the article Stock Analysis with The Power of AI.