Greeting investors! Welcome to our Newsletter, in which we look at the Trending Factors from the second month of 2024. Factors are the building blocks for AI-powered stock market analysis, stock picking, and the creation of robust investment strategies.
Introduction
We are assessing in detail six primary factors – Momentum, Quality, Size, Trend, Value, and Volatility for their significant development to short, mid, and long-term investment strategies. Read more about our 6-Factor (Groups) Investment Model.
Trending factors from last month
The two most significant factors for February 2024 were CCI 4 under the Momentum category, and OperCash-FlowToMarketCap Position 66 under the Quality factor group. The specific results revealed that Momentum underwent a decline of −28.90%, led by a significant drop in the value of CCI 4 at −168.56%. In contrast, Quality, represented by OperCashFlowToMarketCap Position 66, also saw a decline but less drastic, down −7.93%, with a rising top mover by 111.38%.
Description of selected factors
CCI 4 (Momentum group of factors)
The Commodity Channel Index (CCI 4) measures the difference between a security’s price change and its average price change. High values show unusually high prices compared to the average price, while low values show otherwise, offering traders insights into pricing behavior momentum.
OperCashFlowToMarketCap Position 66 (Quality group of factors)
The indicator compares operational cash flow to market capitalization, providing a measure of quality. Companies operating with ample cash flow are financially healthier and signify good quality in this context.
Is it worth selecting stocks for your portfolio based on these factors? We will find out in our analysis.
Factor Statistics 01.02.2024 – 29.02.2024
| Top mover factor within the factor group | Mover value | Factor group | Group total value |
|---|---|---|---|
| CCI_4 | -1.6856 | momentum | -0.2890 |
| OperCashFlowToMarketCap_Position_66 | +1.1138 | quality | -0.0793 |
| CurrencyVolumeRelChange_5vs22 | -1.7218 | size | -0.4027 |
| Smooth_5_Volume_WMA_10 | -0.1532 | trend | -0.0096 |
| PriceToFreeCashFlow_Change_66 | -0.9798 | value | -0.1545 |
| Skewness_10 | -1.5412 | volatility | -0.2003 |
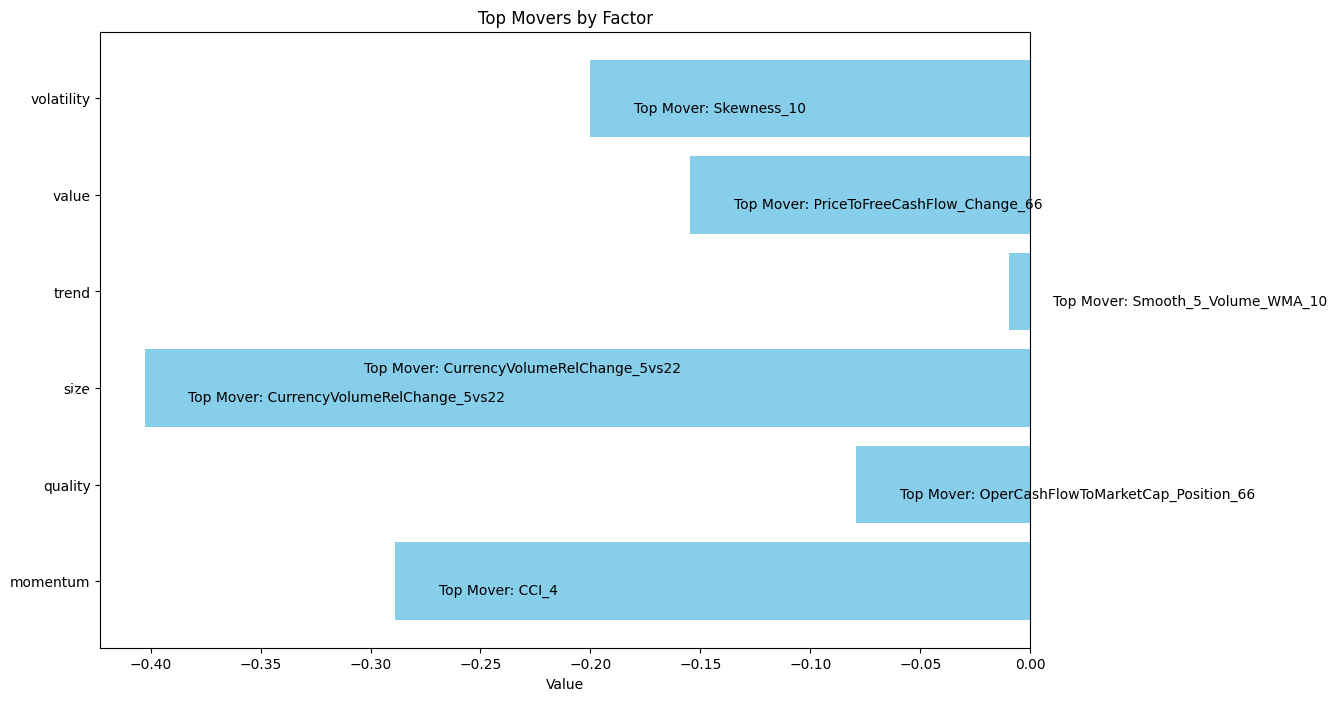
Top Movers by Factor 01.02.2024 – 29.02.2024
The figure shows the Top Movers across all the groups of factors we use in our analytics.
Let’s take a look at how traders who believed in the two most trending factors have fared in recent years
Statistics for factors
Factor Statistics 1990 – 2024
| Top mover factor within the factor group | T-Stat | P-Value | Direction |
|---|---|---|---|
| CCI_4 | +0.9356 | +0.1752 | -1.0 |
| OperCashFlowToMarketCap_Position_66 | +0.6283 | +0.2652 | +1.0 |
| CurrencyVolumeRelChange_5vs22 | +0.6856 | +0.2468 | +1.0 |
| Smooth_5_Volume_WMA_10 | +1.1143 | +0.1331 | +1.0 |
| PriceToFreeCashFlow_Change_66 | +0.7115 | +0.2387 | +1.0 |
| Skewness_10 | +0.0843 | +0.4664 | +1.0 |
In the table, we can see the T-Stat and P-Value for the entire period of history for which we evaluate the factors, i.e. 1990 – 2024. The Direction value shows the direction in which the factor affects the movement of the share price, +1 expresses the positive impact of the increasing factor on the share price, and -1 expresses the negative impact of the increasing value of the factor on the share price. In simple terms of theory, we can say that a T-statistic that is greater than 2.0 or less than -2.0 is statistically significant; and if the P-value is less than 0.05, we reject the null hypothesis and say that we found a statistically significant effect.
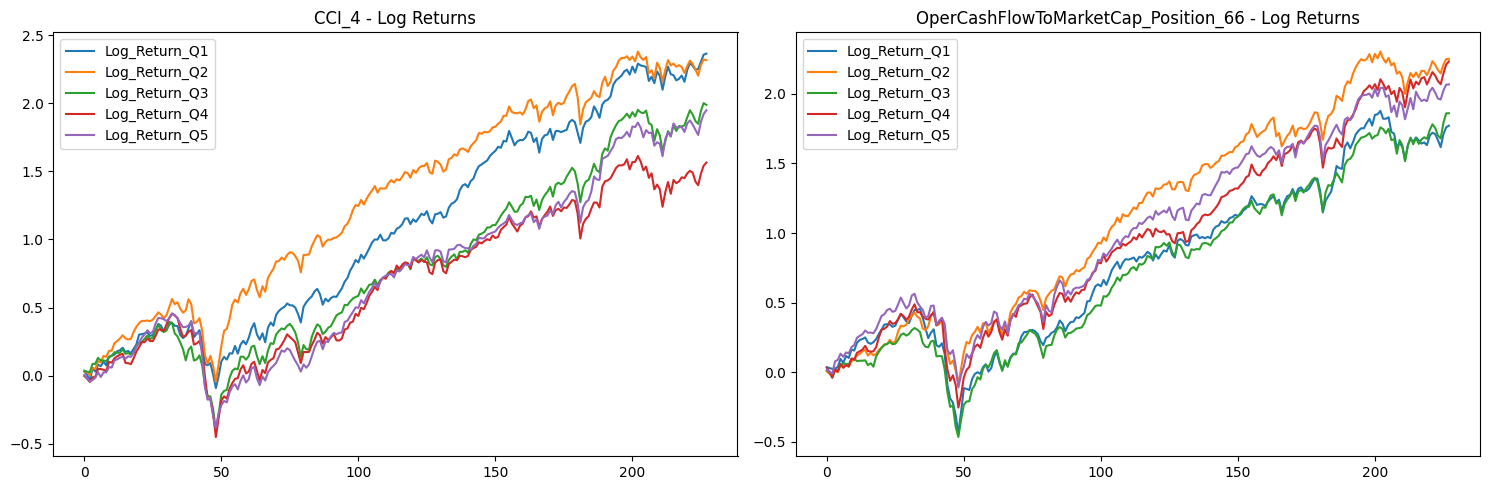
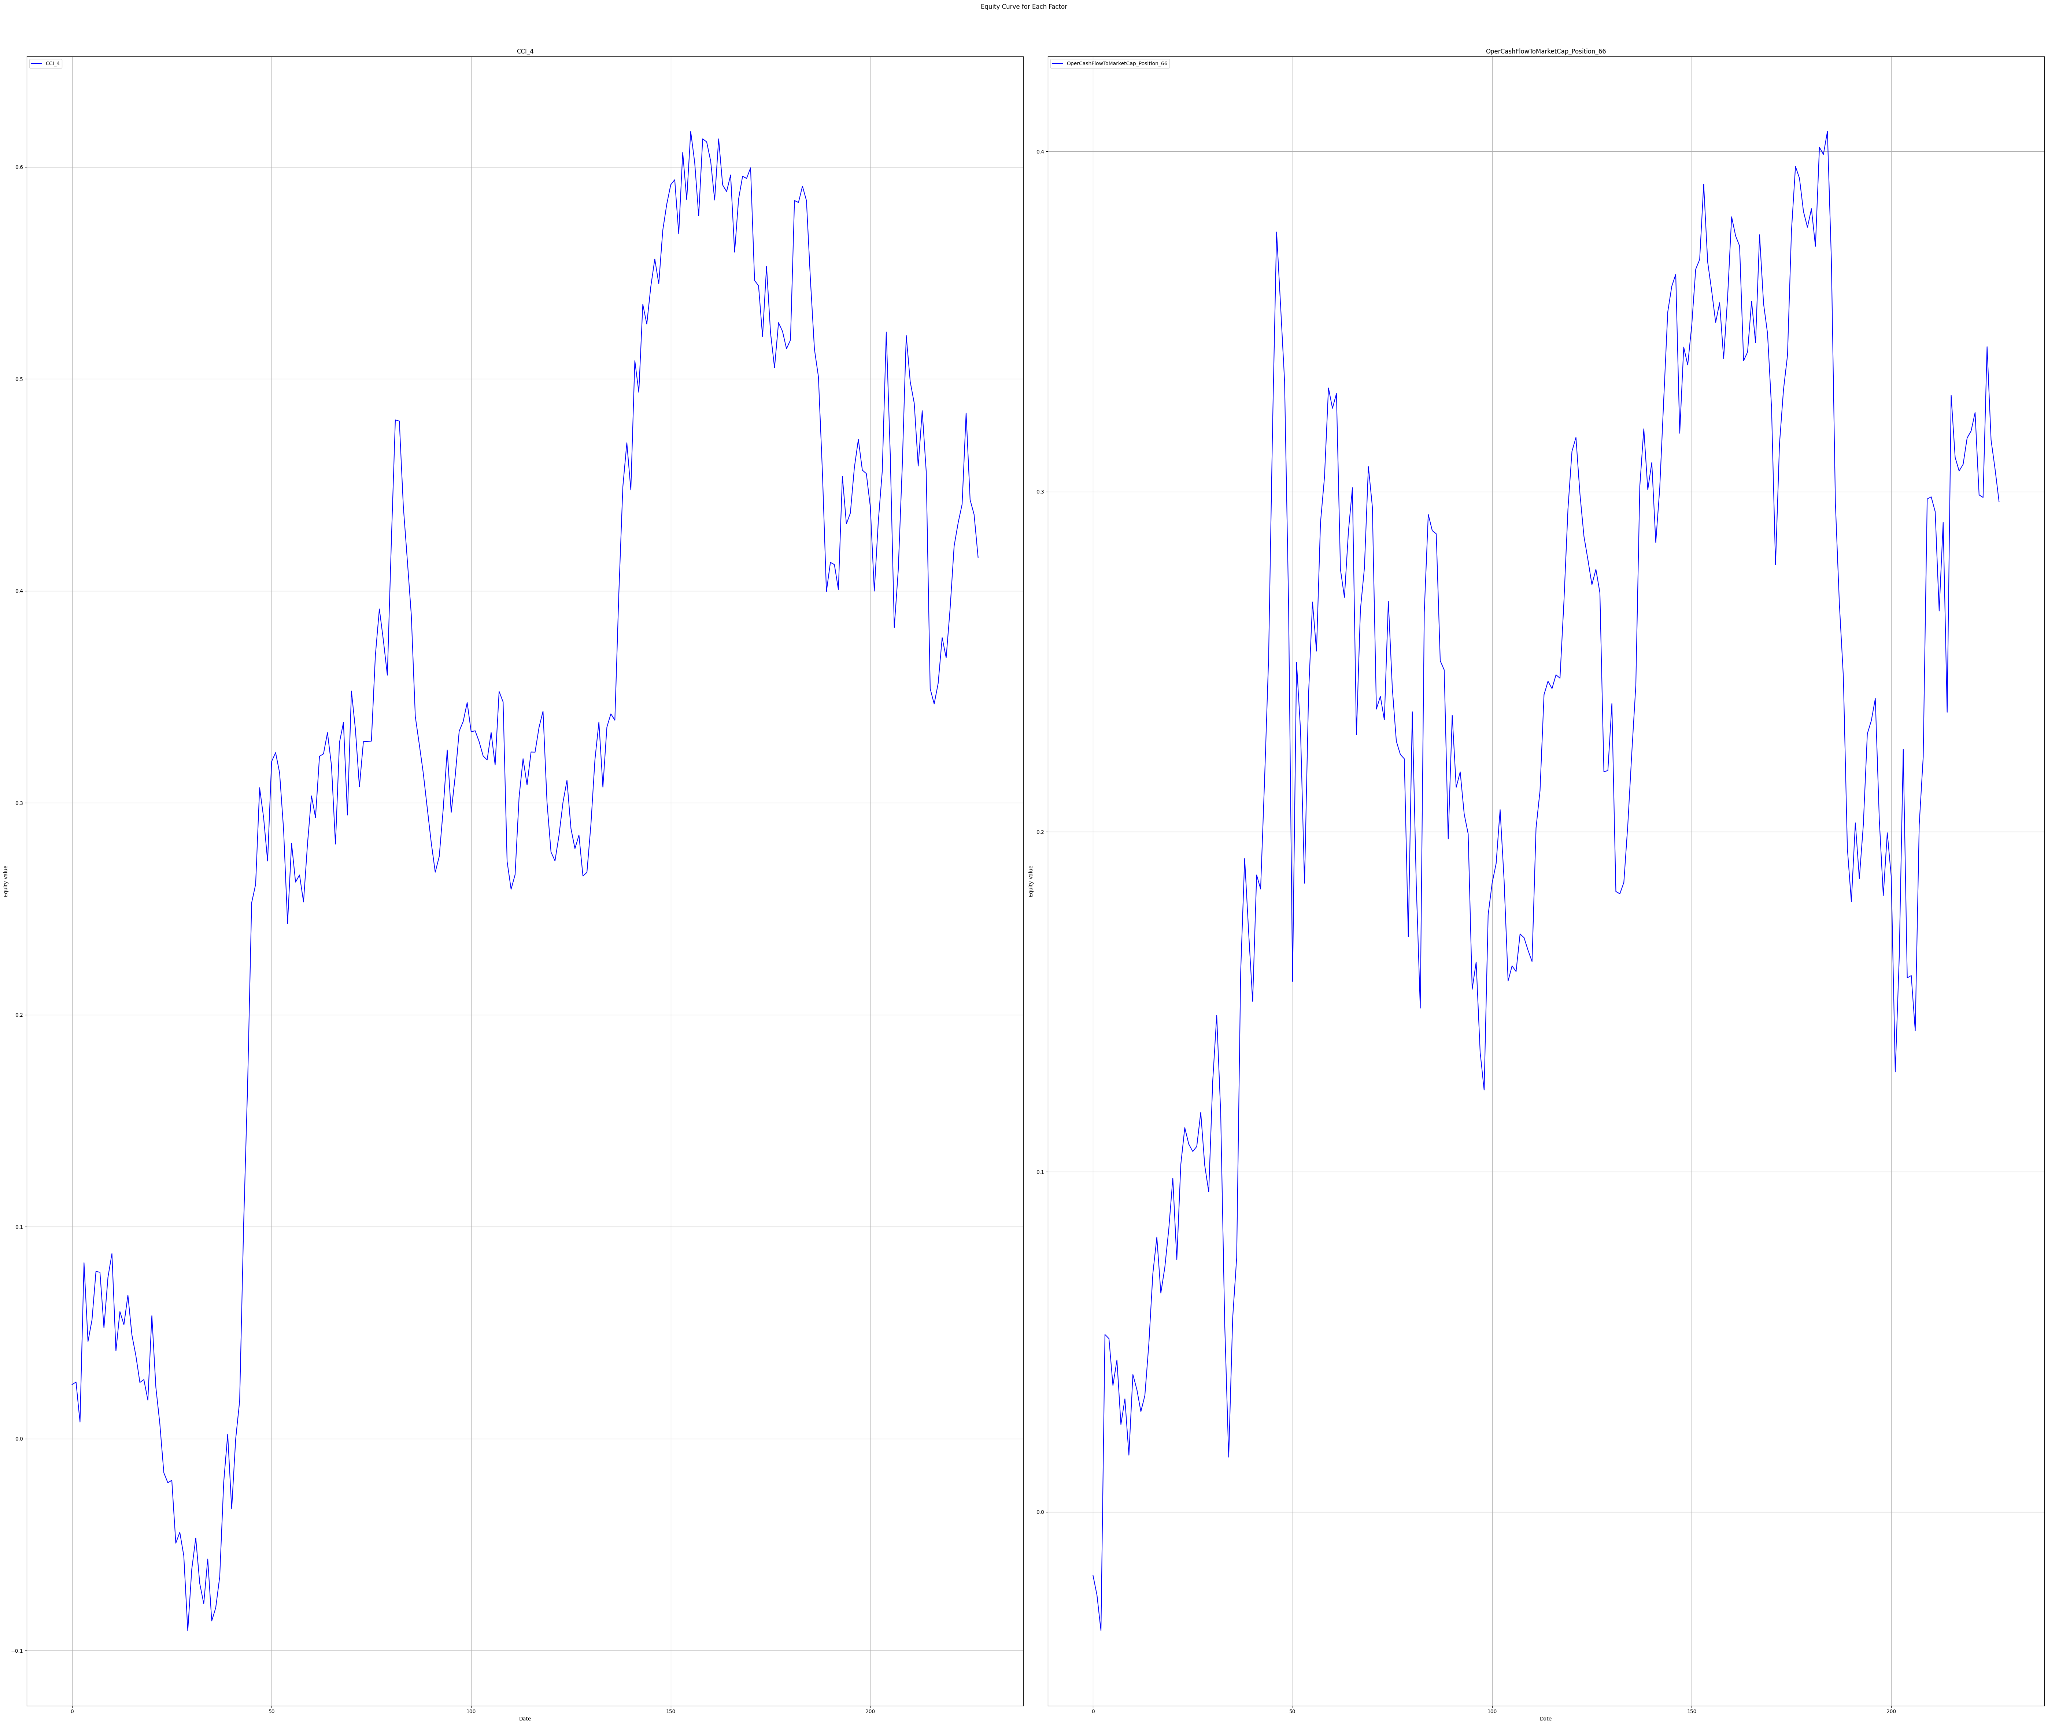
To understand the performance of these factors, we delve into their long-only portfolios based on quantiles, and long-short portfolio returns. The five quantiles (Q1-Q5) divide the data into equal parts according to the respective factor value, creating a picture of distribution across the portfolios. Investors usually target Q1 or Q5 portfolios of a factor, depending on whether the higher or lower value of the factor is expected to outperform.
The charts below show Factor Statistics 1990 – 2024 for the 2 selected factors from the previous month.
While the next one shows the behavior of the factors in the last 4 years.
Factor Statistics 2020 – 2024
| Top mover factor within the factor group | T-Stat | P-Value | Direction |
|---|---|---|---|
| CCI_4 | +0.3941 | +0.3476 | +1.0 |
| OperCashFlowToMarketCap_Position_66 | -0.3382 | +0.6316 | -1.0 |
| CurrencyVolumeRelChange_5vs22 | +0.1496 | +0.4408 | +1.0 |
| Smooth_5_Volume_WMA_10 | +0.4714 | +0.3197 | +1.0 |
| PriceToFreeCashFlow_Change_66 | +1.1742 | +0.1231 | +1.0 |
| Skewness_10 | +1.9446 | +0.0289 | +1.0 |
The charts below show Factor Statistics 2020 – 2024 for the 2 selected factors from the previous month.
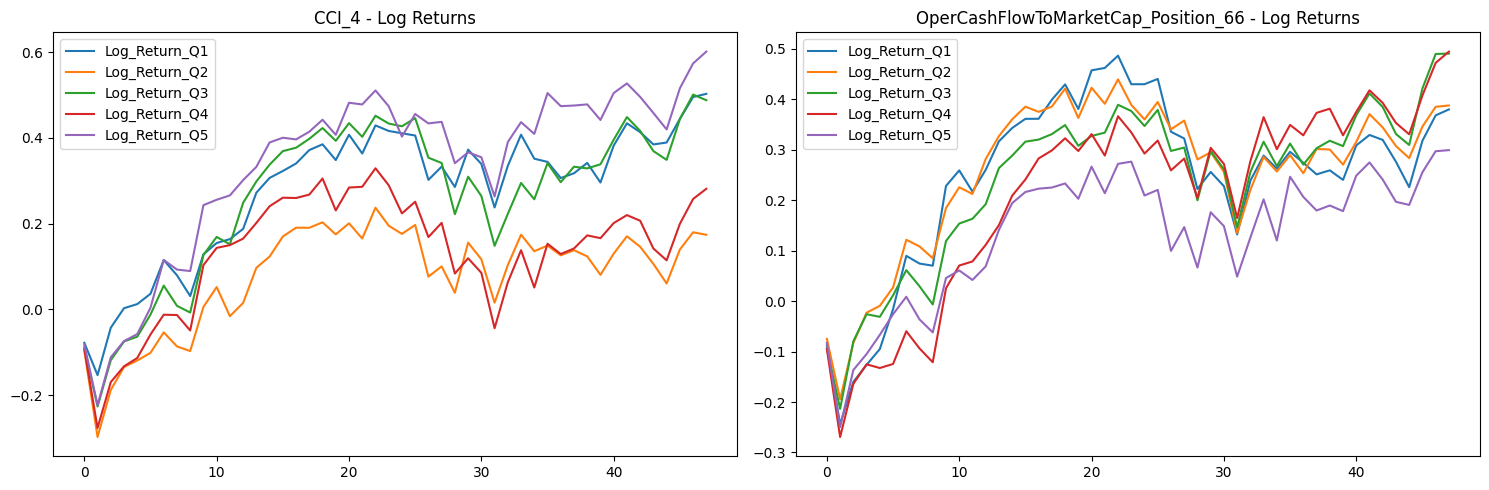
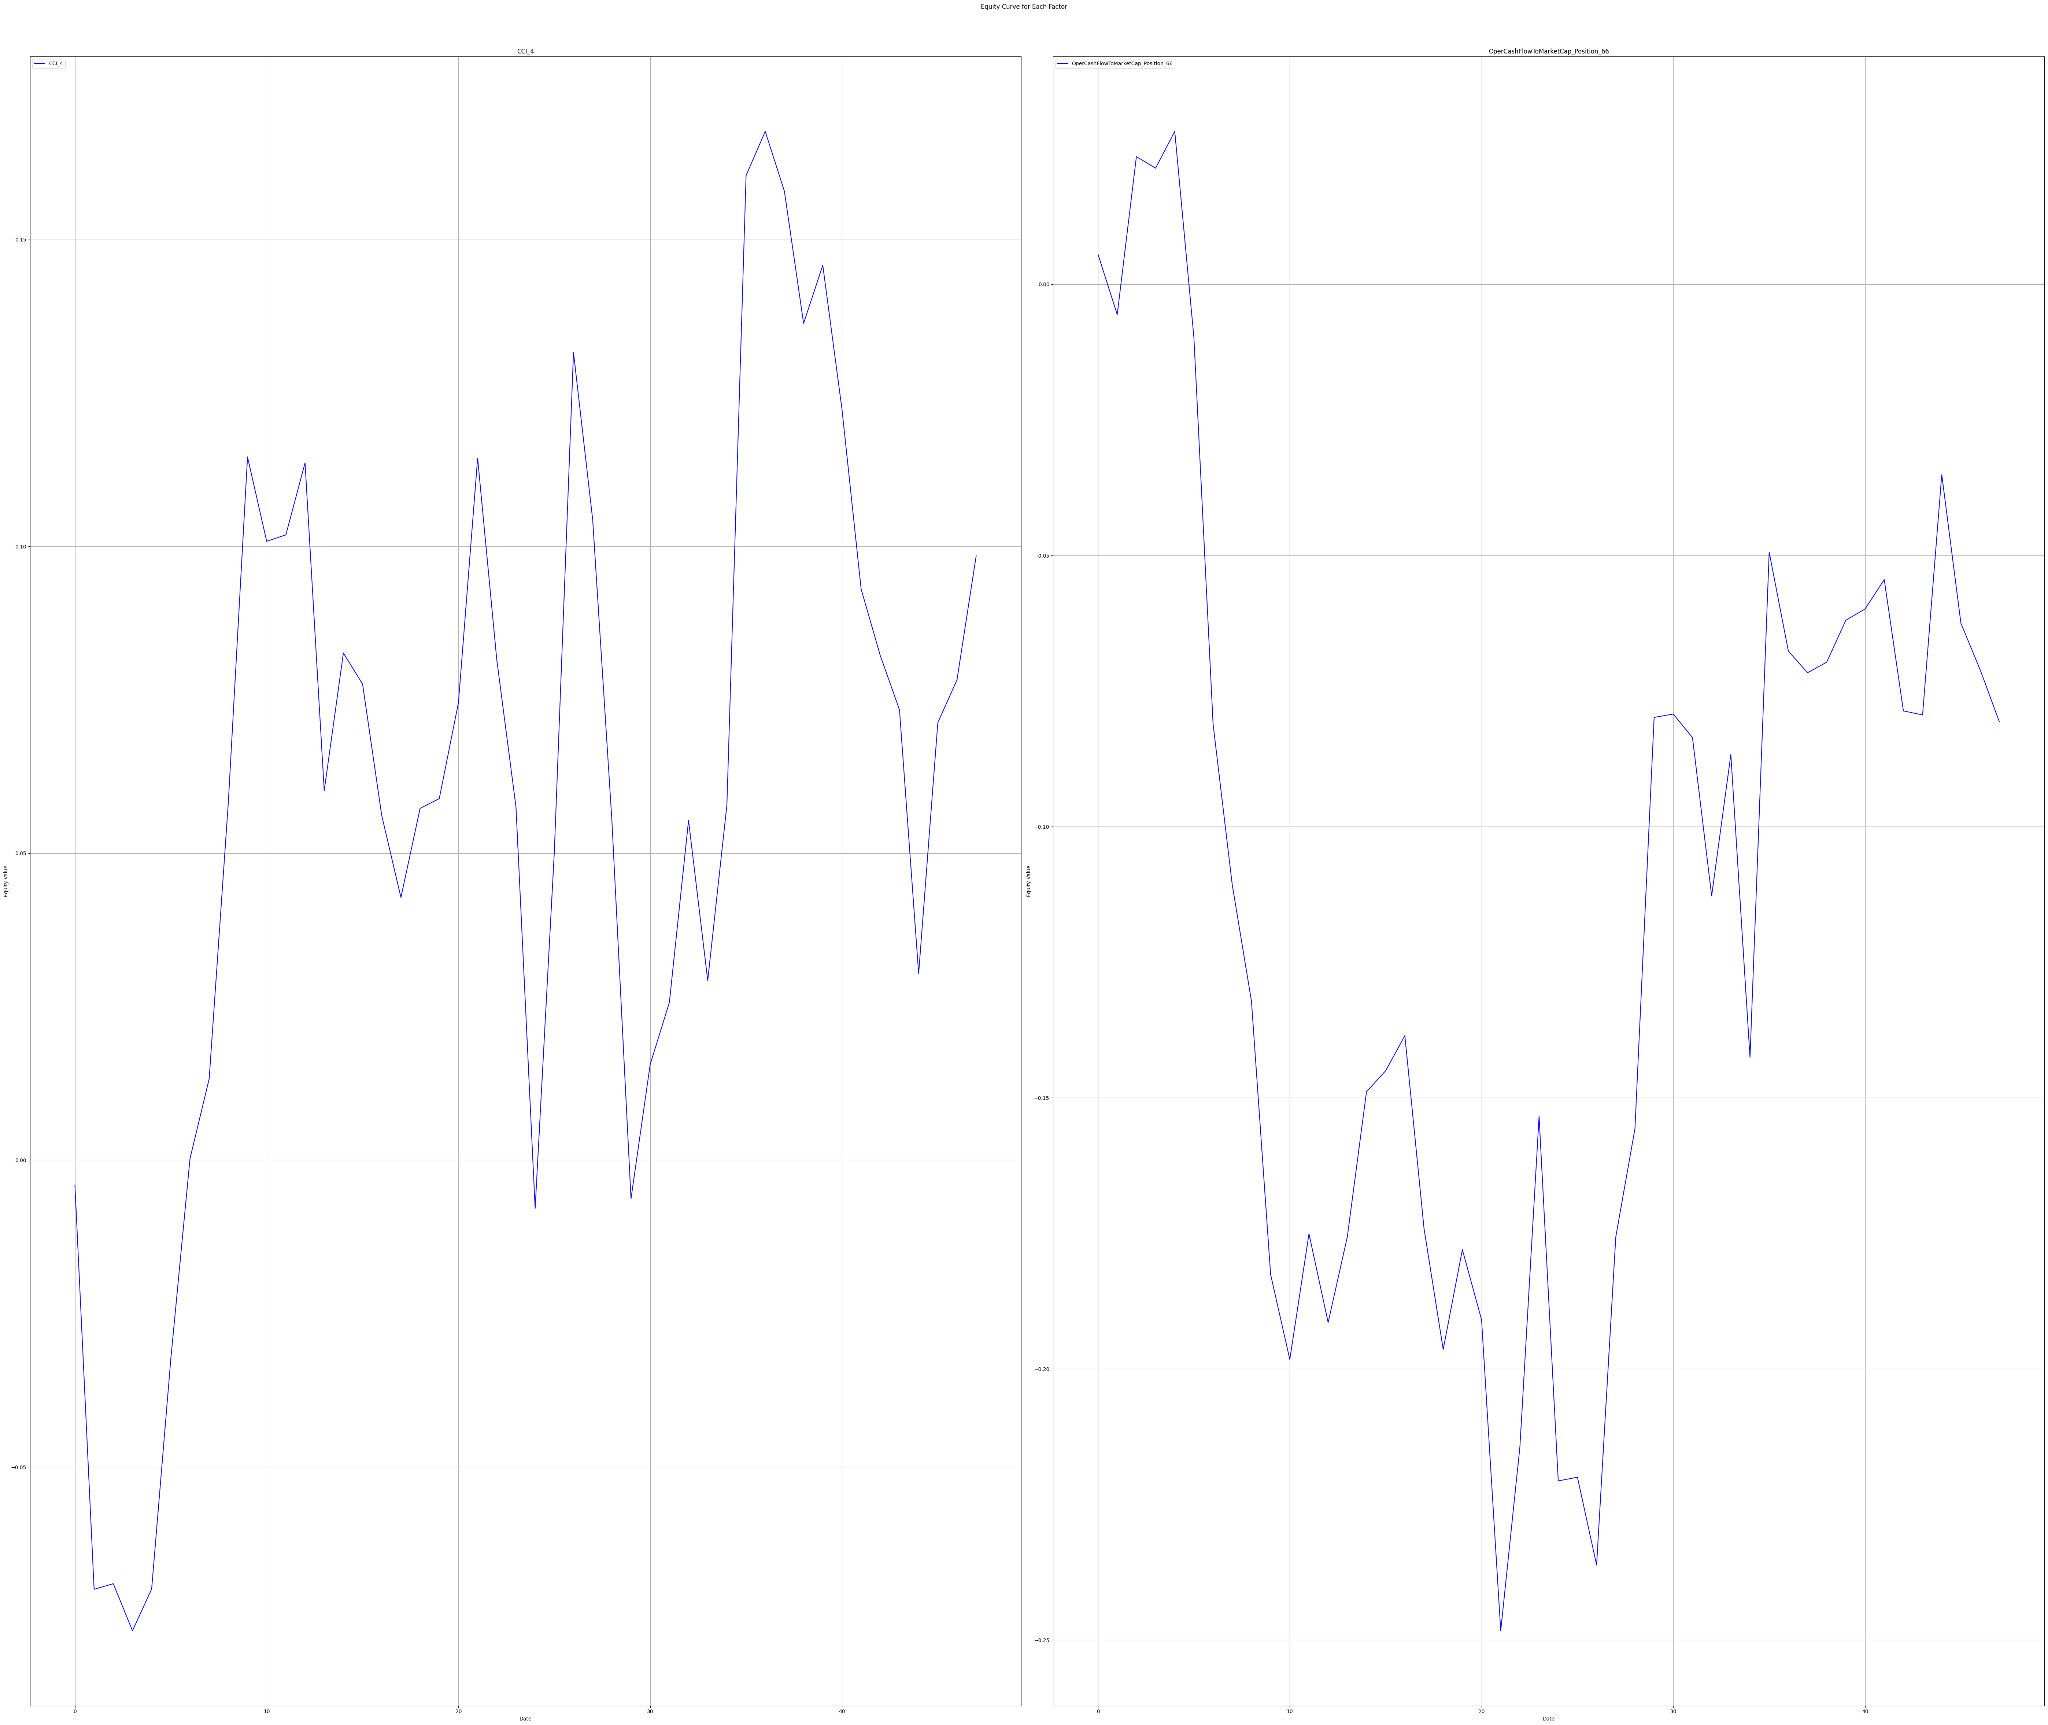
Factor Statistics Insights
From the T-Stat values we can see that the most trending factors are not highly statistically significant. This is reflected in the results we can see in the graphs shown. Also, the effect of the factors on share price movements was exactly the opposite of the long-term history in the period 200-2024.
Do you want to invest in statistically significant factors that work over the long term? Try our Factor Investing app.
Invest in the forces that move stock prices
Leverage the power of factor investing with revolutionary software
Using factors in AI Stock Analysis
Our AI-powered StockPicking Lab is built on the factor investing approach combined with machine learning. We say that the most effective way to use AI to find the most undervalued stocks is to look for factors that influence stock price movements before matching appropriate stocks to them.
- In the first step, we focus on understanding the relationship between the high/low value of the factor under study for the stocks under consideration and the price movement of these stocks.
- Subsequently, we evaluate statistical significance using the P-value and T-statistic to select only the significant factors that we use to build the stock valuation model. There is no AI involved so far. However, this step already eliminates the basic problem of analysts evaluating stocks based on statistically insignificant factors and indicators.
These two points are the focus of our regular TAOTS. - In the next step, we can stack (ideally uncorrelated) factors into our model. This is where AI-based stock analysis comes in, as machine learning and its state-of-the-art methods should be used to select the best-performing uncorrelated factors and build robust stock strategies that work in most market situations. These investment strategies are what the StockPicking Lab provides. Read more in the article Stock Analysis with The Power of AI.