The world of statistics is filled with many complex concepts, but few are as misunderstood as the P-value. Despite its widespread use in research and quantitative analysis, it often confuses even the most seasoned statisticians. So, let’s break it down and make it easy to understand how the P-value can be used in factor analysis and AI-based stock analysis.
What is a P-value?
In the simplest terms, a P-value is a probability. It’s a measure used in statistical testing to help you make decisions about your data. When you perform a statistical test, you’re usually trying to disprove a null hypothesis – an assumption that there is no effect or relationship between two or more variables in your study.
This statistical measurement tells you how likely you would get your observed data if the null hypothesis were true. A smaller P-value means that the observed data is less likely under the null hypothesis, and thus provides stronger evidence against it. So, to be completely basic:
If the P-value is under the threshold then the factor is significant and it is not due to random chance.
How is it calculated?
Imagine you’re tossing a coin. The null hypothesis might be that the coin is fair, meaning it has an equal chance of landing heads or tails. You flip the coin 100 times and get 60 heads. Is this just a random chance, or is the coin biased towards heads?
To calculate the number, you’d calculate the probability of getting 60 or more heads in 100 flips, assuming the coin is fair. If this probability (the P-value) is small, say less than 0.05, you might conclude that the coin is not fair.
The P-Value in Practice
In practice, a common threshold for P-value is 0.05. If the P-value is less than 0.05, we reject the null hypothesis and say that we found a statistically significant effect. If the number is greater than 0.05, we do not reject the null hypothesis and say that we did not find a statistically significant effect.
However, it’s important to remember that a P-value is not a measure of the size or importance of an effect. A small number simply tells us that the effect is unlikely to have occurred by chance, assuming the null hypothesis is true.
The P-Value in Stock Market Analysis
In the world of stock market and quantitative analysis, P-values play a crucial role. Analysts use them to test hypotheses about market behavior, the effectiveness of trading strategies, and the relevance of financial indicators.
For example, an analyst might hypothesize that a certain stock’s returns are ‘influenced’ by the performance of the overall market. The null hypothesis would be that there is no relationship between the two. By calculating the number, the analyst can determine whether the observed relationship in the data is statistically significant or just due to random chance.
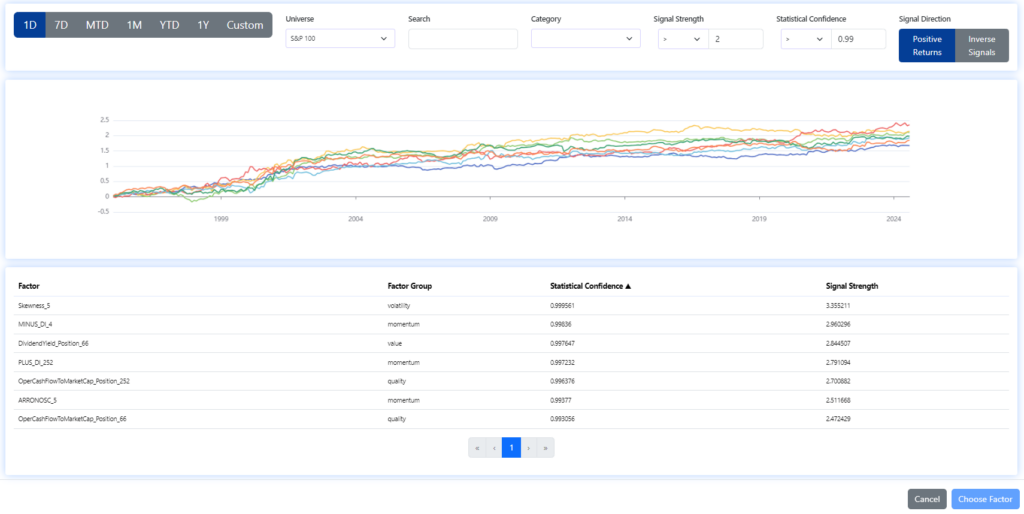
In our Factor Investing App, you can see P-value values for more than 1,000 factors used for investment decision-making.
Register today & enjoy one month
FREE trial of our application

Misinterpretations
One common misinterpretation of the P-value is that it represents the probability that the null hypothesis is true. This is not correct. The P-value is conditional on the null hypothesis being true and does not provide direct information about its truth.
Another common misunderstanding is equating statistical significance with practicality. A small P-value might indicate a statistically significant effect, but this effect might be so small that it has no practical implications.
Limitations
While P-values can be useful, they also have limitations. They depend on the sample size – with larger samples, very small effects can be statistically significant. They also don’t tell us about the size of the effect, the importance of the effect, or the cost of being wrong.
Using P-Value in AI Stock Analysis
Our AI-powered StockPicking Lab is built on the factor investing approach combined with machine learning.
- In the first step, we focus on understanding the relationship between the high/low value of the factor under study for the stocks under consideration and the price movement of these stocks.
- Subsequently, we evaluate statistical significance using the P-value and T-statistic to select only the significant factors that we use to build the stock valuation model. There is no AI involved so far. However, this step already eliminates the basic problem of analysts evaluating stocks based on statistically insignificant factors and indicators.
- In the next step, we can stack (ideally uncorrelated) factors into our model. This is where AI-based stock analysis comes in, as machine learning and its state-of-the-art methods should be used to select the best-performing uncorrelated factors and build robust stock strategies that work in most market situations.
Conclusion
Understanding P-values is crucial for interpreting statistical results, whether in academic research, market analysis, or other fields. While the concept can seem daunting, it becomes much more approachable when broken down into its basic elements: it’s a measure of probability used to weigh evidence against a null hypothesis.
Remember, a small P-value indicates strong evidence against the null hypothesis, but it’s not a measure of the effect’s size or importance. As with all statistical tools, P-values should be used responsibly and in conjunction with other methods to make informed decisions.