The AP on the Street 48th week of 2023 – Trending Factors

The AP on the Street 48th week of 2023 – Trending Factors
The latest edition of our factor-driven weekly newsletter is here, shedding light on the trending factors from the week of 27.11.2023 – 01.12.2023. Read the e-mail version.
Introduction
Welcome back to The AP on the Street, your trusted source for exclusive insights into the ever-evolving dynamics of the stock market. This week, we dive deeper into the developments surrounding six key factors that are driving the market trends: Momentum, Quality, Size, Trend, Value, and Volatility. We’ll closely follow the weekly data changes, examine the top movers for each factor, and provide an analytical breakdown of two such top movers contributing to these factors. The goal is to equip you with precision expert analysis that can guide your investment strategies.
Trending factors from last week
Based on the data for the 48th week of 2023, our attention is drawn to two top movers: Volume ROCR100 5 affiliated with the Momentum factor and CurrencyVolumeAbsChange 5vs10 from the Size factor which have shown significant movements.
Description of selected factors
Volume ROCR100 5 is a measure related to momentum trading which calculates the rate of change (ROC) in the volume over the last 100 days, then compares this to the volume 5 days ago. It is a volatility-adjusted measurement and helps identify potential reversals, highs, and lows, and provides a prevailing view of the market’s emotional state.
CurrencyVolumeAbsChange 5vs10 is concerned with the Size factor. It calculates the absolute change in the currency volume over the past 5 days compared to the previous 10 days. This measure helps to signal an increase in trading activity which could indicate a trend change and is a good indicator of liquidity conditions in the market.
Invest in the forces that move stock prices
Leverage the power of factor investing with revolutionary software
Factor Statistics 27.11.2023 – 01.12.2023
| Top mover factor within the factor group | Mover value | Factor group | Group total value |
|---|---|---|---|
| Volume_ROCR100_5 | +6.5568 | momentum | -0.1561 |
| OperCashFlowToMarketCap_reported_calc_Position_66 | -0.0896 | quality | -0.0021 |
| CurrencyVolumeAbsChange_5vs10 | -2.3866 | size | -0.3290 |
| Volume_WMA_2 | +1.2778 | trend | +0.0393 |
| DividendYield_reported_Change_126 | -0.1699 | value | +0.0127 |
| Autocovariance_5 | -1.2594 | volatility | -0.0782 |
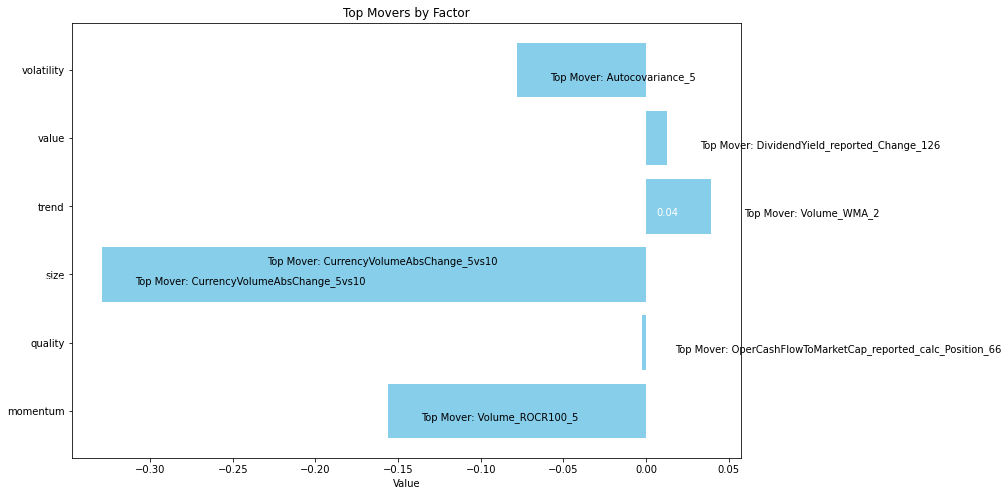
At the dawn of the 48th week, the Momentum factor group showed a decrease of 16% while the Size factor also decreased at a rate of %33. Despite this decline, the Volume ROCR100 5, a key contributor to Momentum, showed an increased value of 656%. On the other hand, CurrencyVolumeAbsChange 5vs10 decreased by 239%, making it a top mover in the Size factor group.
Let’s take a look at how traders who believed in the two most trending factors have fared in recent years
Statistics for factors
Factor Statistics 1990 – 2023
| Top mover factor within the factor group | T-Stat | P-Value | Direction |
|---|---|---|---|
| Volume_ROCR100_5 | +1.3028 | +0.0964 | +1.0 |
| CurrencyVolumeAbsChange_5vs10 | +1.2392 | +0.1077 | -1.0 |
In the table, we can see the T-Stat and P-Value for the entire period of history for which we evaluate the factors, i.e. 1990 – 2023. The Direction value shows the direction in which the factor affects the movement of the share price, +1 expresses the positive impact of the increasing factor on the share price, and -1 expresses the negative impact of the increasing value of the factor on the share price.
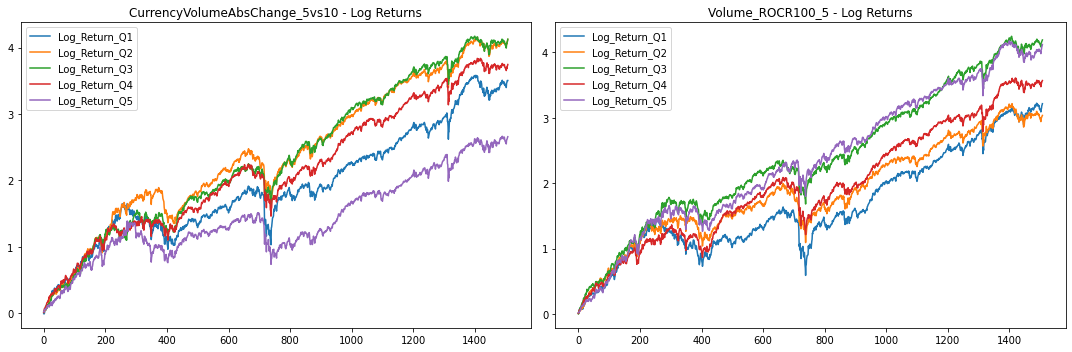
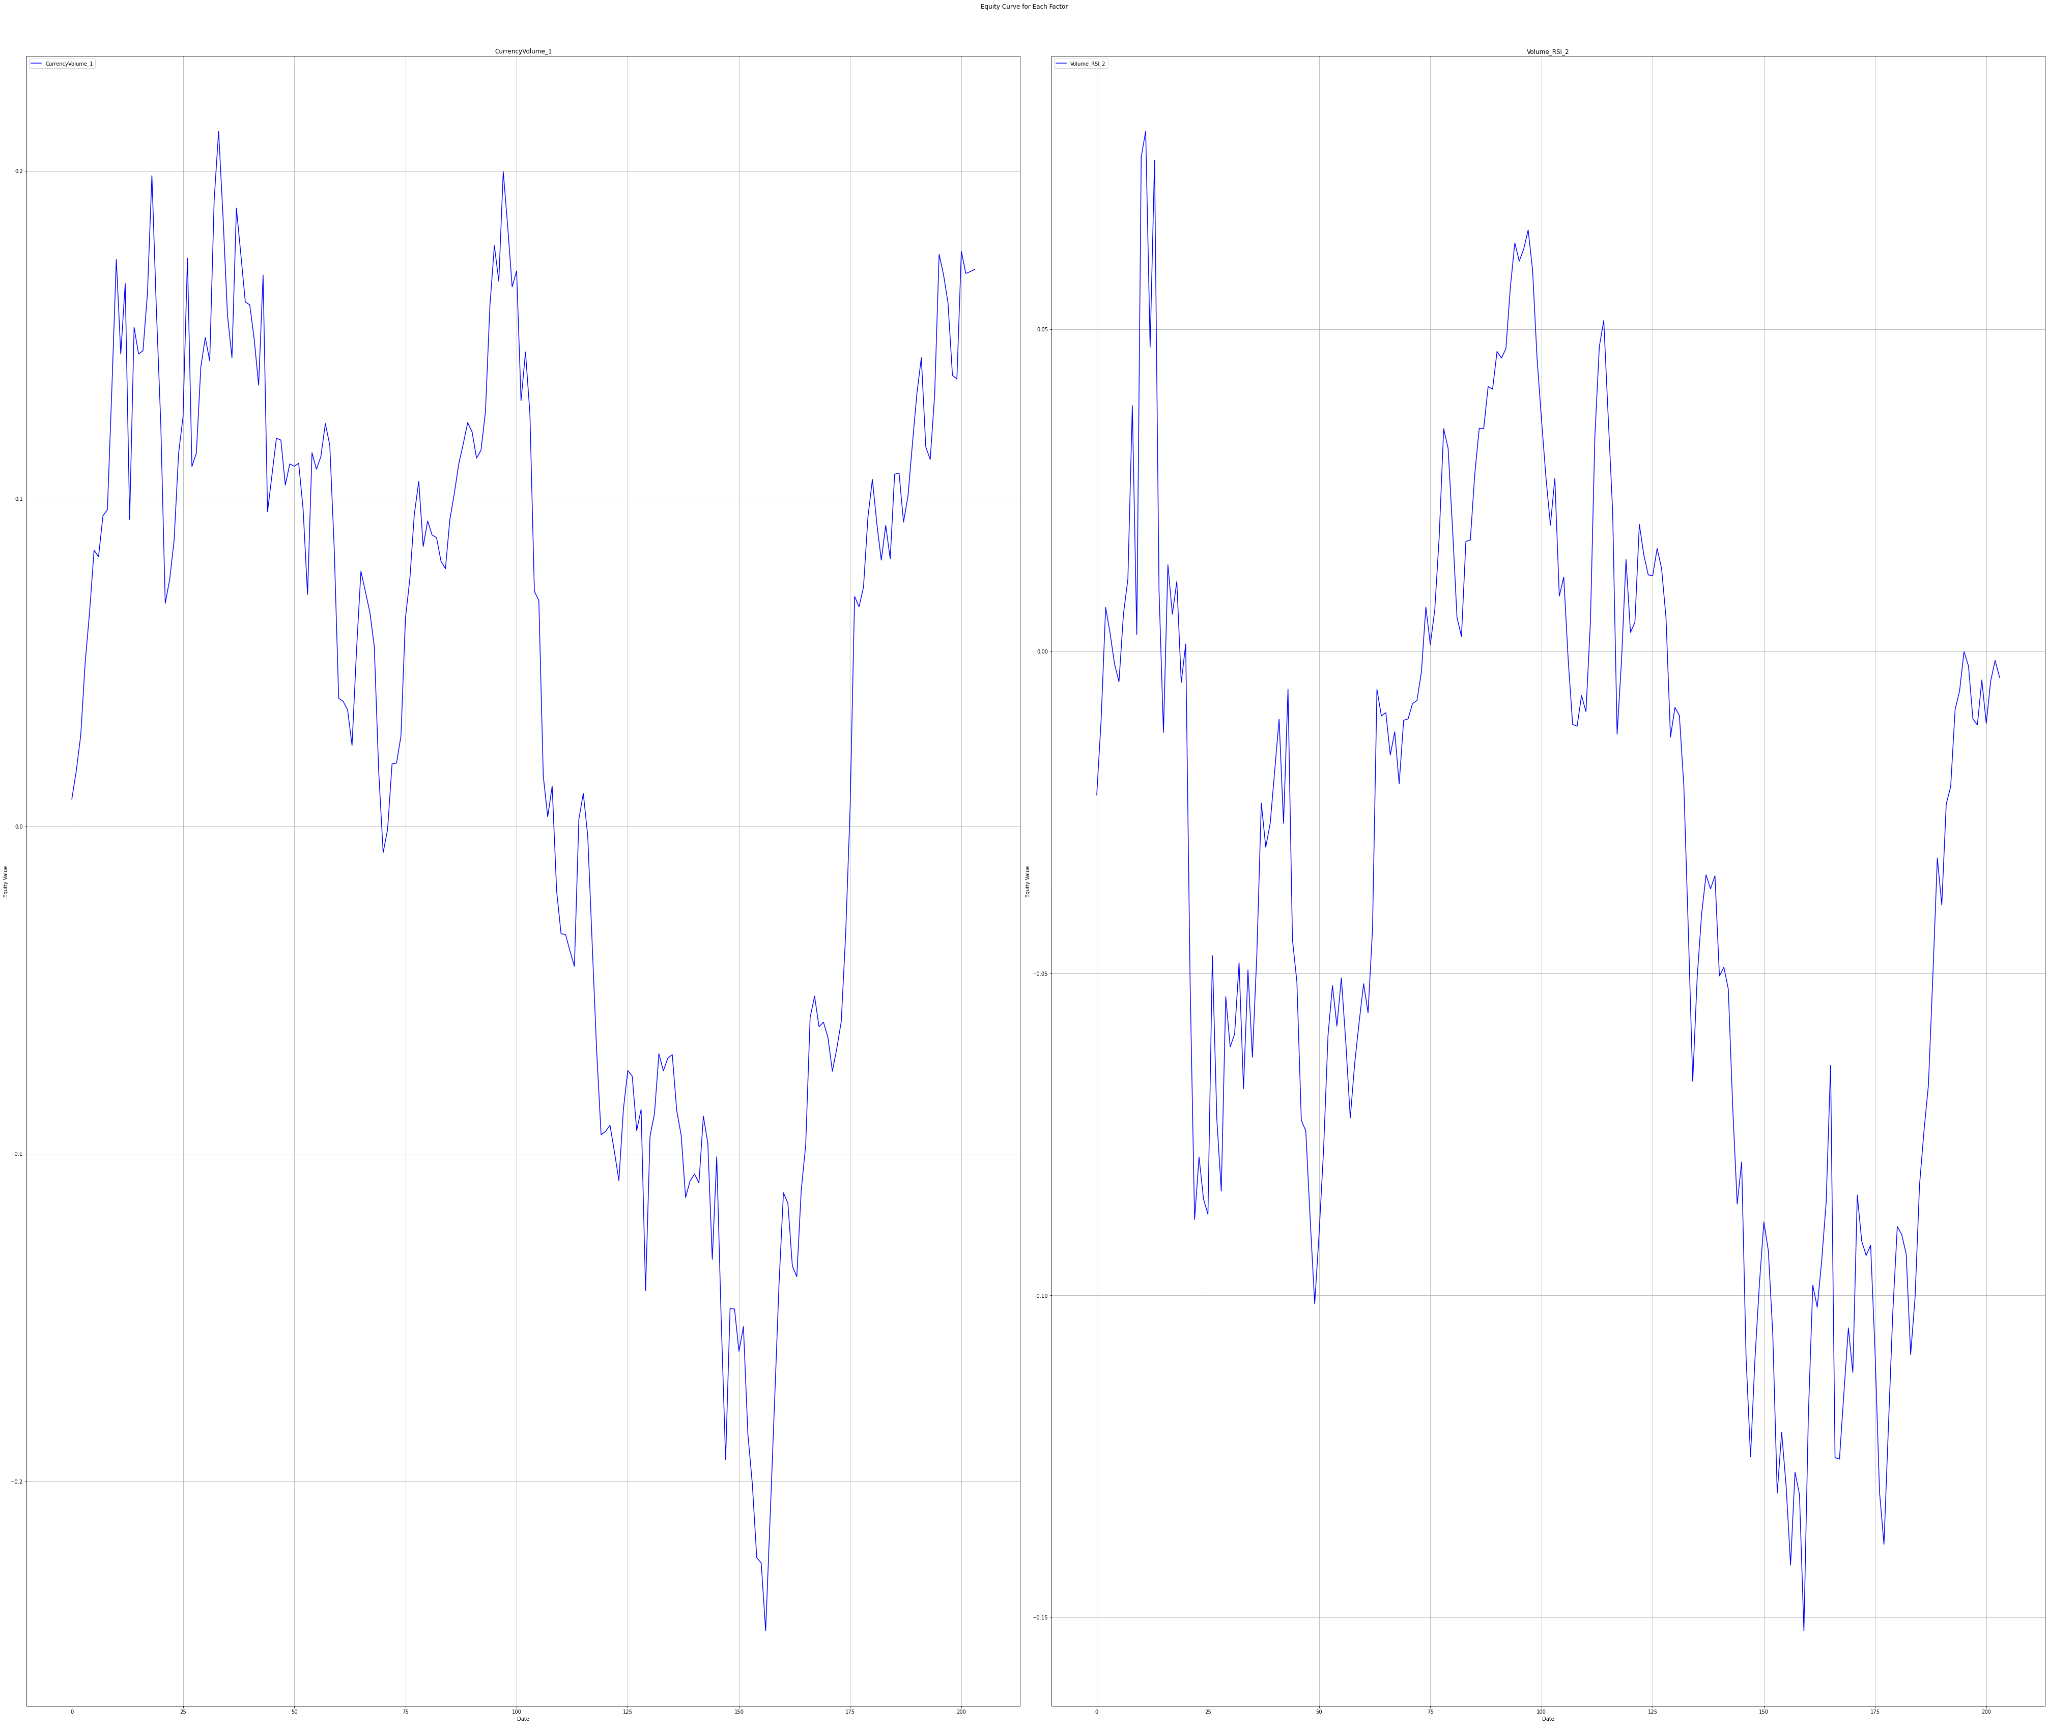
The charts below show Factor Statistics 1990 – 2023 for the 2 selected factors from the previous week.
While the next one shows the behavior of the factors in the last 3 years.
Factor Statistics 2020 – 2023
| Top mover factor within the factor group | T-Stat | P-Value | Direction |
|---|---|---|---|
| Volume_ROCR100_5 | -0.2640 | 0.6040 | -1.0 |
| CurrencyVolumeAbsChange_5vs10 | -1.1245 | 0.8689 | -1.0 |
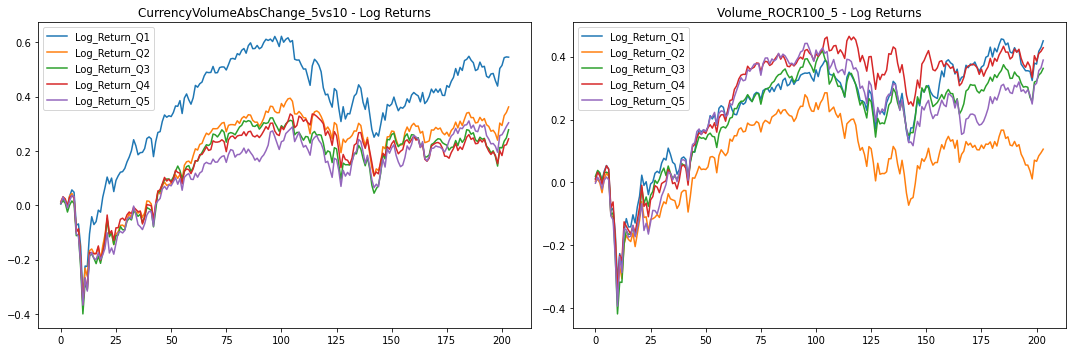
The charts below show Factor Statistics 2020 – 2023 for the 2 selected factors from the previous week.
Factor Statistics Insights
We have calculated returns for long-only portfolios mimicking the factor values, so we have created 5 portfolios consisting of stock affiliated to the specific portfolio/quantile by their factor values.
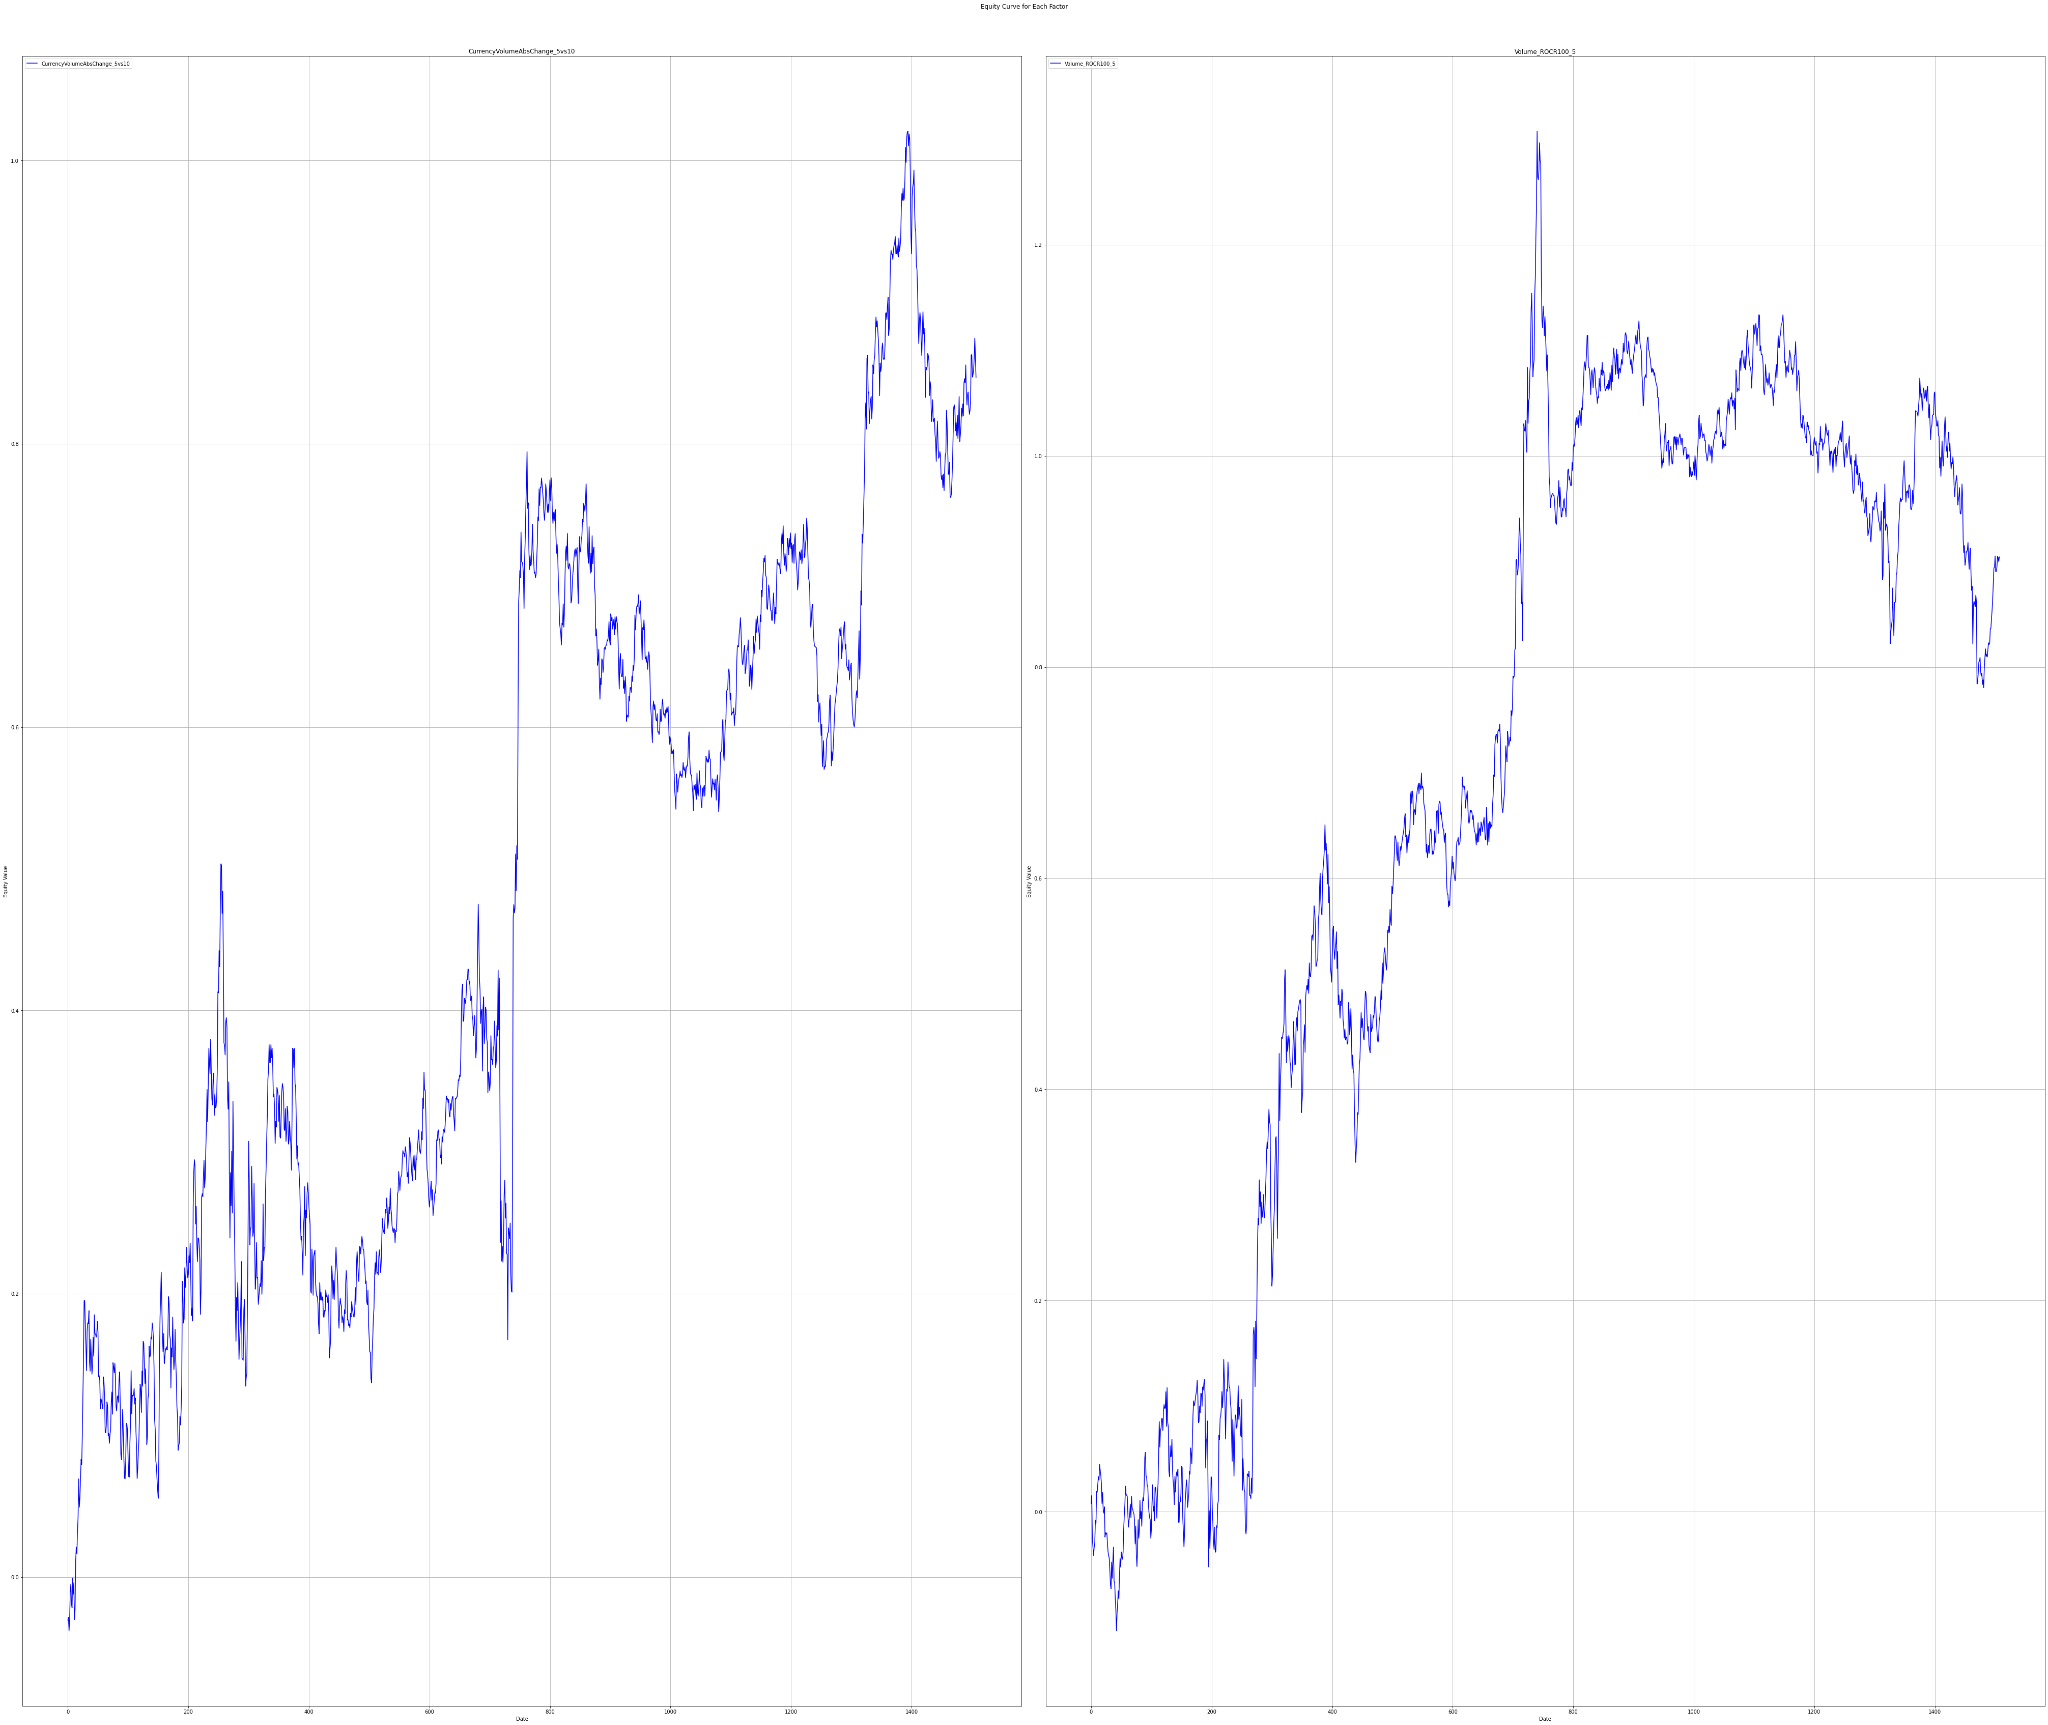
Additionally to the long-only factor mimicking portfolios, we have computed returns for a long-short portfolio designed as market neutral portfolio where the long leg consists of stocks in the fifth quantile while the short leg consists of the first quantile. If the factor is impactful, the difference between long-side and short-side returns should be significantly different from zero.
In the long run, both factors show promising performance despite there being short-term volatile periods. Such behavior is common for changing market environments and evolving both macro and firm-specific dynamics. Note that the effect on price movements for Volume_ROCR100_5 has been exactly the opposite of the long-term history over the past three years.
Using factors in AI Stock Analysis
Our AI-powered StockPicking Lab is built on the factor investing approach combined with machine learning.
- In the first step, we focus on understanding the relationship between the high/low value of the factor under study for the stocks under consideration and the price movement of these stocks.
- Subsequently, we evaluate statistical significance using the P-value and T-statistic to select only the significant factors that we use to build the stock valuation model. There is no AI involved so far. However, this step already eliminates the basic problem of analysts evaluating stocks based on statistically insignificant factors and indicators.
These two points are the focus of our regular TAOTS. - In the next step, we can stack (ideally uncorrelated) factors into our model. This is where AI-based stock analysis comes in, as machine learning and its state-of-the-art methods should be used to select the best-performing uncorrelated factors and build robust stock strategies that work in most market situations. These investment strategies are what the StockPicking Lab provides. Read more in the article Stock Analysis with The Power of AI.