The AP on the Street 44th week of 2023 – Trending Factors

The AP on the Street 44th week of 2023 – Trending Factors
The fourth factor-driven weekly newsletter is here. Let’s look at the trending factors from last week (30.10.2023 – 03.11.2023) as detected by our factor investing software. First, we identify the most performing Factors in every Group of Factors (Momentum, Quality, Size, Trend, Volatility). In the second step, we are focusing in more detail on two selected factors. Read the e-mail version.
Trending factors from last week
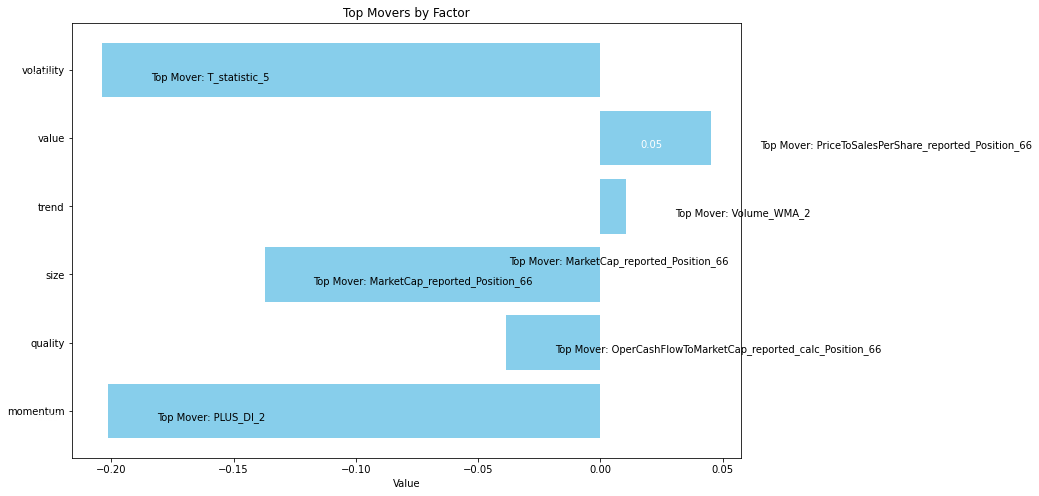
The previous week the most trending factors were PLUS DI whose exposure jumped up by a whopping 2287%! and T statistics 5 whose value went down 335%. In 42nd TAOTS we have already talked about the MINUS DI 2 factor whose description is equivalent to PLUS DI, only with the opposite sign. The same situation is with the T statistics 10/ 5, only difference is in the time horizon. In this newsletter, we will therefore focus on other trending factors, specifically Market Cap Position 66 and Price to Sales Per Share Position 66.
Factor Statistics 30.10.2023 – 03.11.2023
Market Cap Position 66 is a financial indicator designed to assess the relative position of a company’s market capitalization within a specified historical range over a 66-day period. Its exposure rose by 191%.
Price to Sales Per Share Position 66 is a financial indicator used to evaluate the P/S of a company within a 66-day time horizon. This factor value increased by 184%.
| Top mover factor within the factor group | Mover value | Factor group | Group total value | |
| PLUS_DI_2 | +22.8707 | Momentum | -0.0201 | |
| OperCashFlowToMarketCap_reported_calc_Position_66 | -0.4036 | Quality | -0.0384 | |
| MarketCap_reported_Position_66 | +1.9147 | Size | -0.1373 | |
| Volume_WMA_2 | -0.0874 | Trend | +0.0106 | |
| PriceToSalesPerShare_reported_Position_66 | +1.8438 | Value | +0.0452 | |
| T_statistic_5 | -3.3526 | Volatility | -0.2037 | |
Although the value of the Market Cap Reported Position 66 invoice was growing, the impact of the entire Size Factor group of which it is a part was declining. The value of the Price to Sales Per Share Position 66 factor is growing, as is the entire Value group of factors of which it is a part.
Just for the record, the exposure/value of the Momentum Factor group on the S&P 100 has fallen for the fourth week in a row. It means that the category of momentum indicators became less important. On the other hand, the decline in the Momentum Factor group was only 2% which might point to a changing trend.
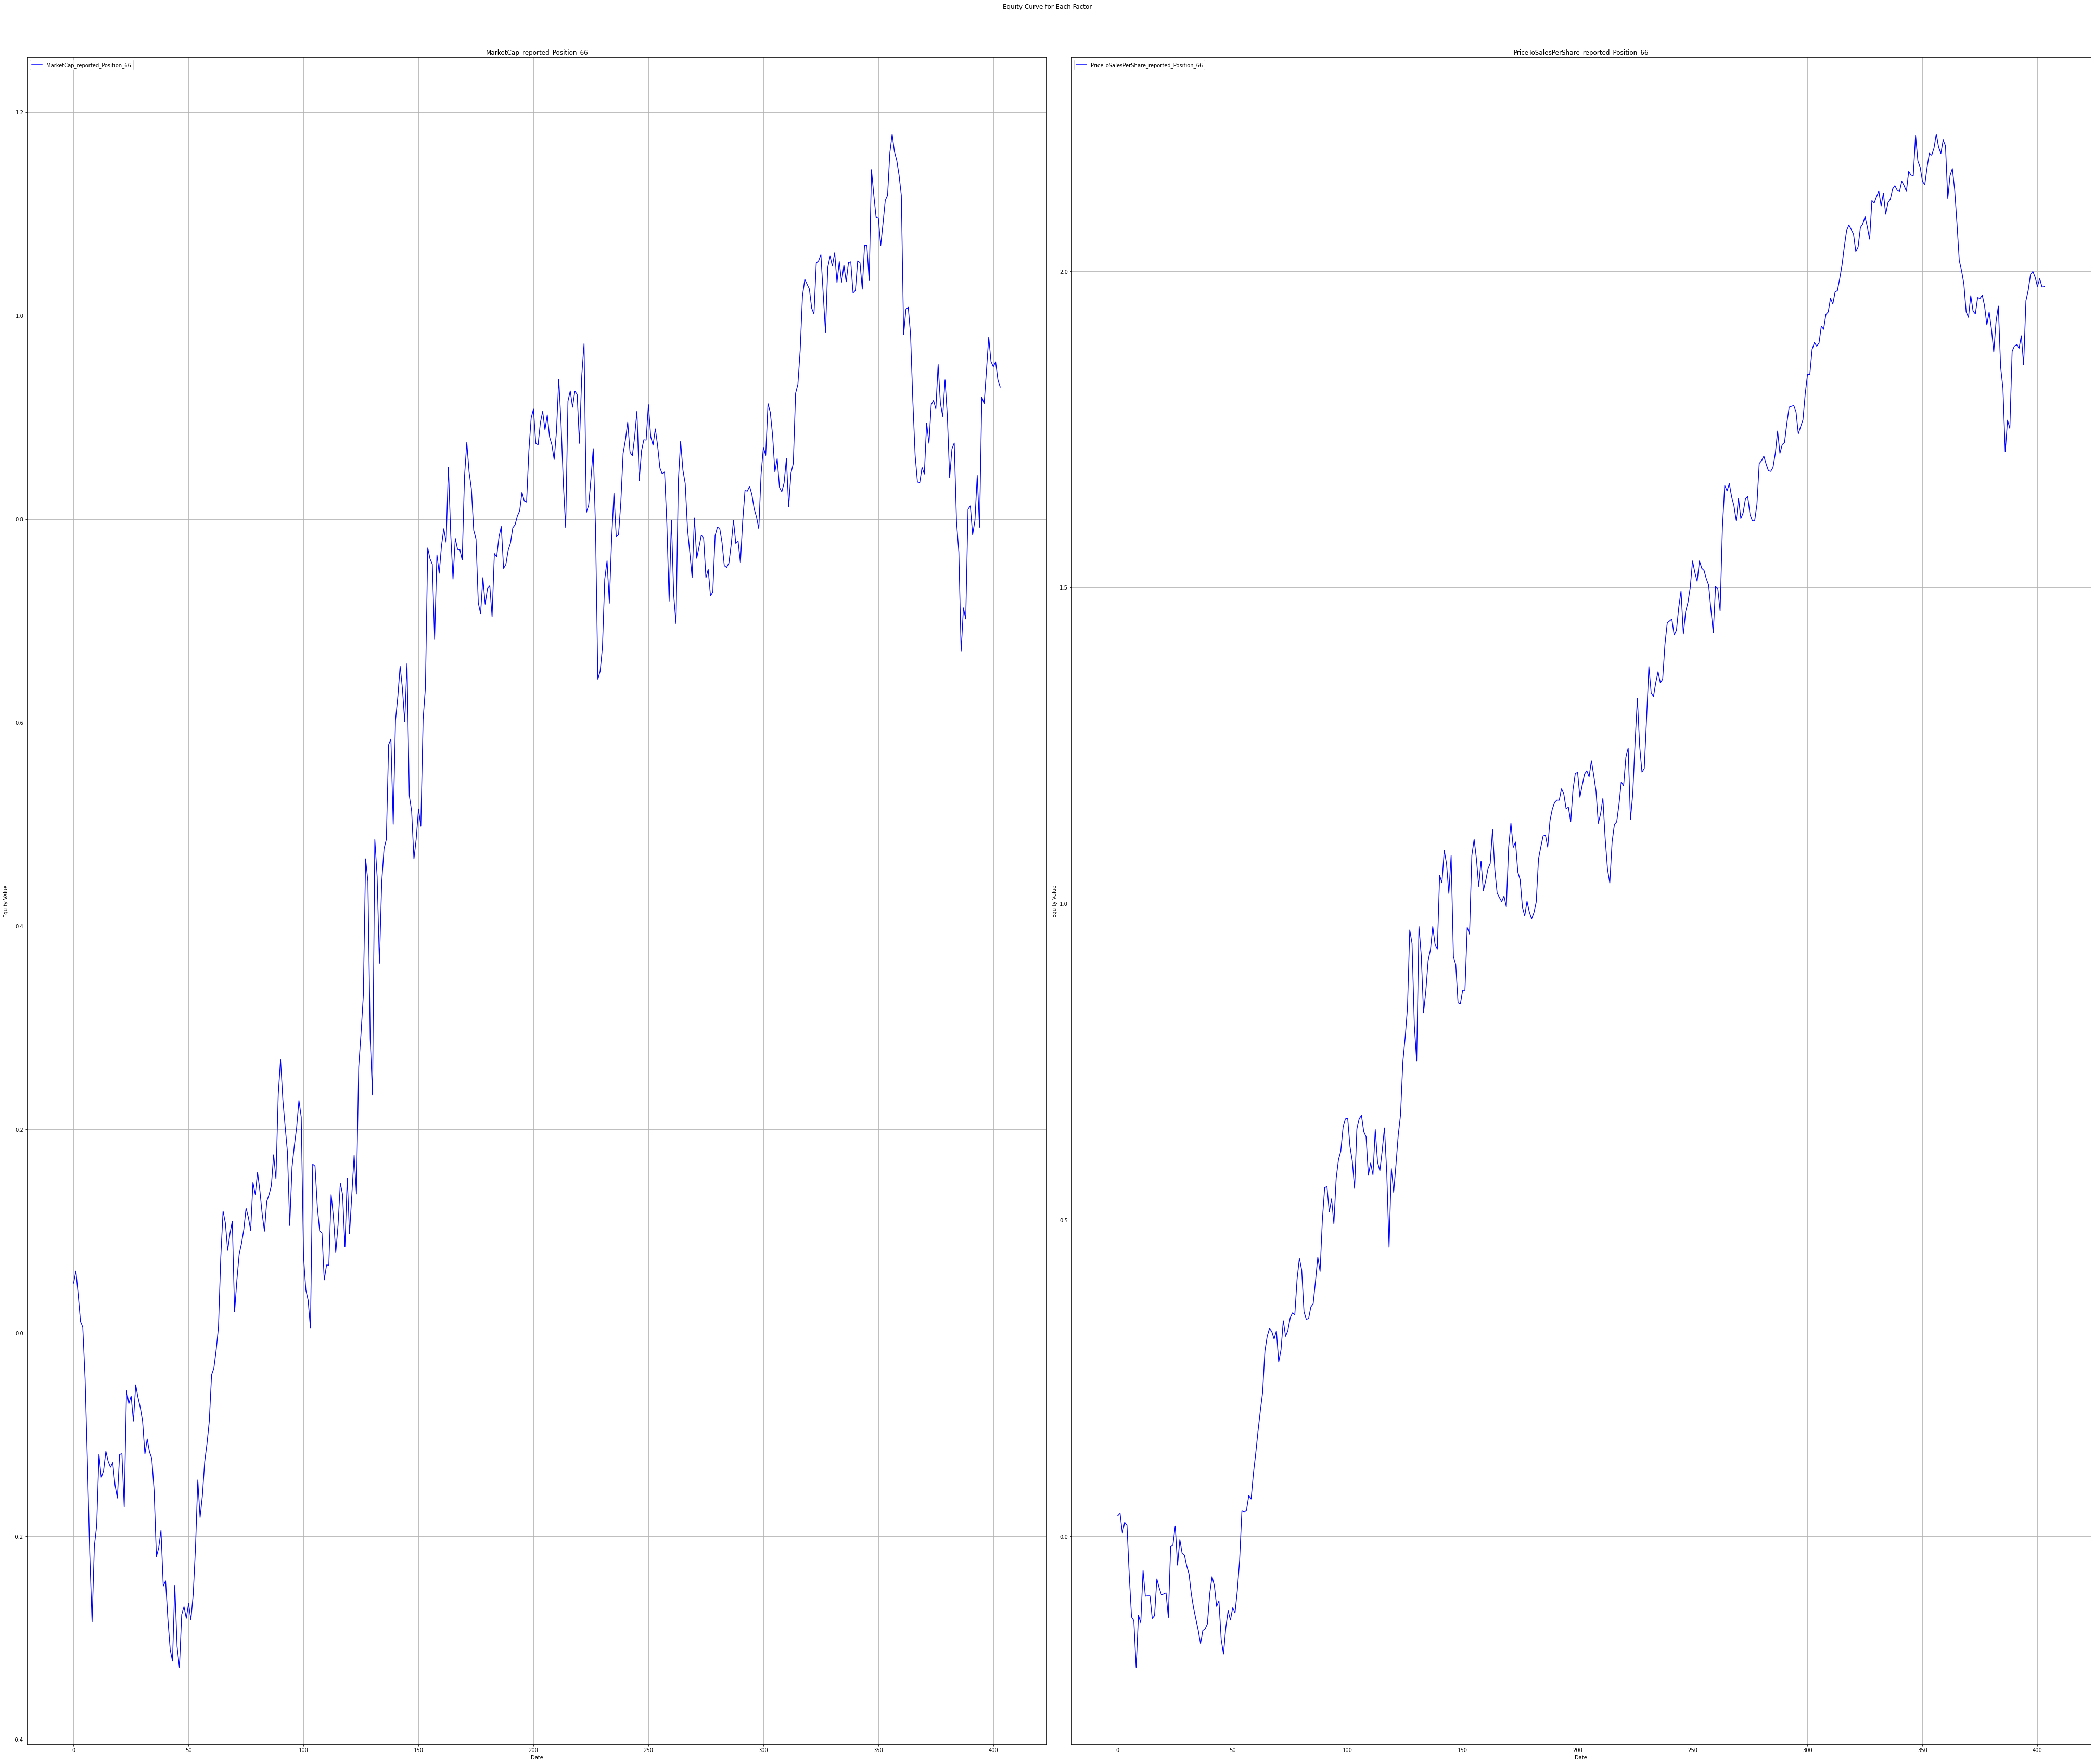
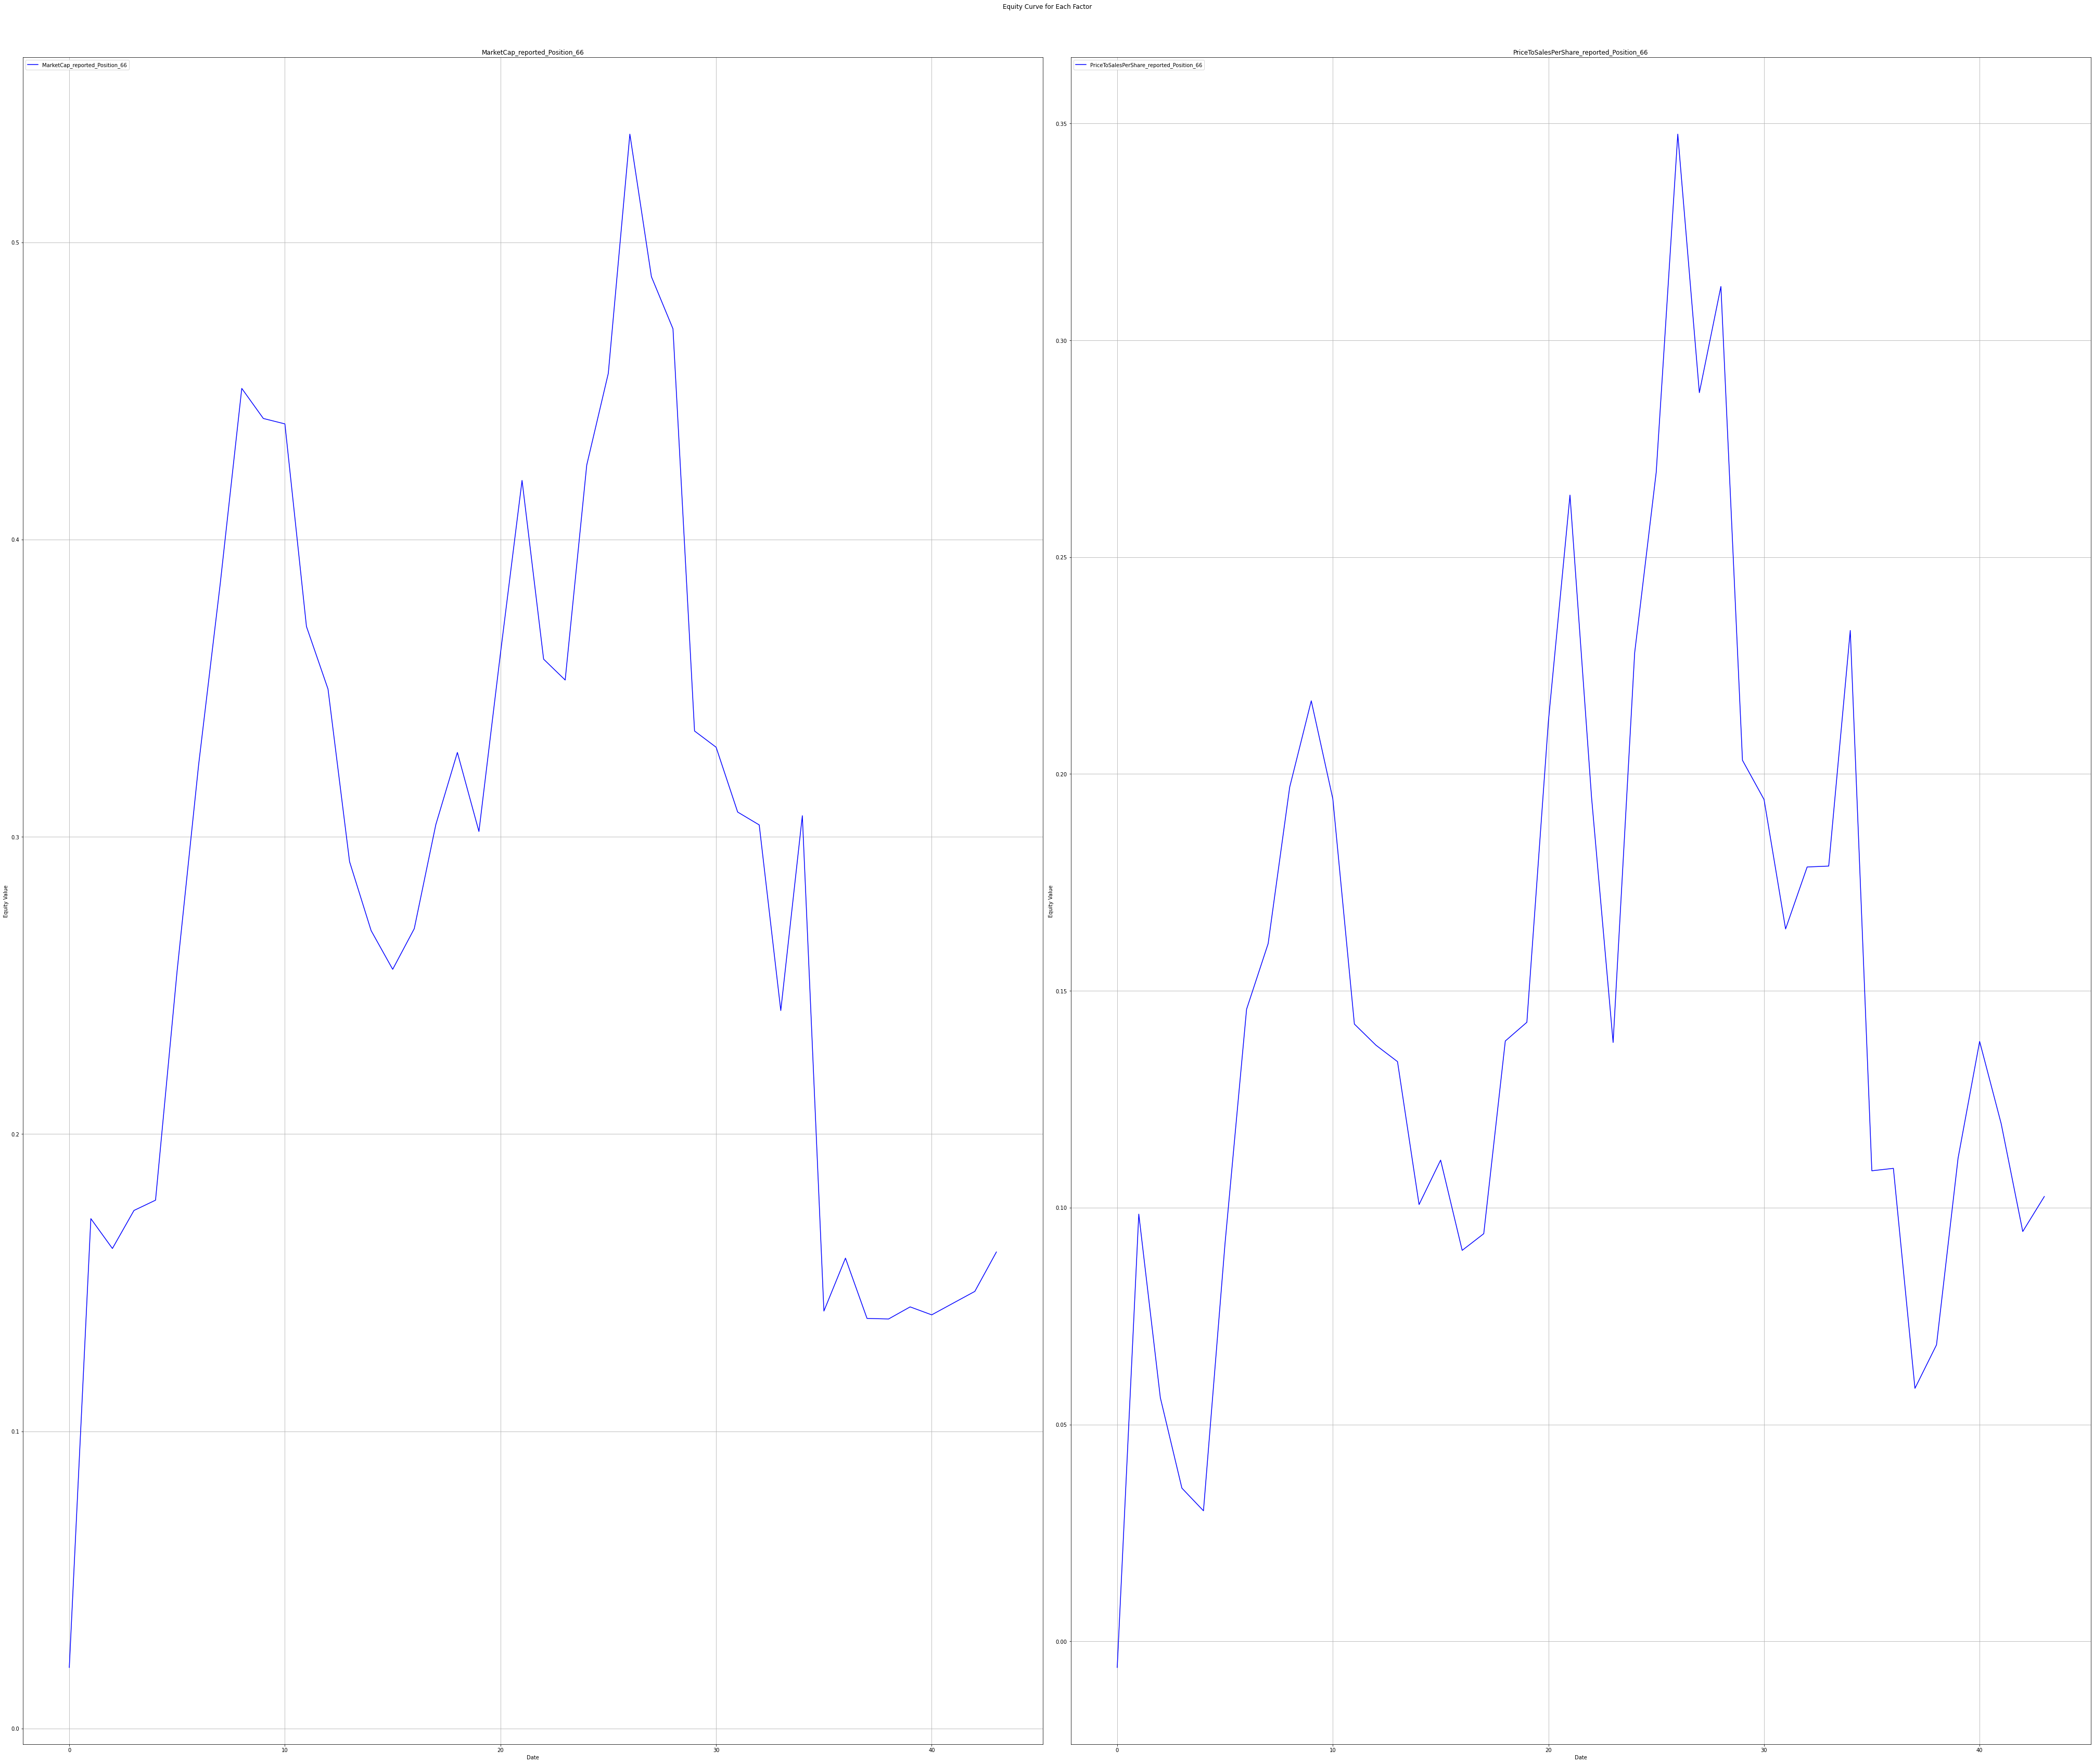
Let’s take a look at how traders who believed in the two most trending factors have fared in recent years
Statistics for factors
Factor Statistics 1990 – 2023
| Top mover factor within the factor group | T-Stat | P-Value | Direction |
| MarketCap_reported_Position_66 | 1.0107 | 0.1564 | -1.0 |
| PriceToSalesPerShare_reported_Position_66 | 2.3993 | 0.0084 | -1.0 |
In the table, we can see the T-Stat and P-Value for the entire period of history for which we evaluate the factors, i.e. 1990 – 2023. The Direction value shows the direction in which the factor affects the movement of the share price, +1 expresses the positive impact of the increasing factor on the share price, and -1 expresses the negative impact of the increasing value of the factor on the share price.
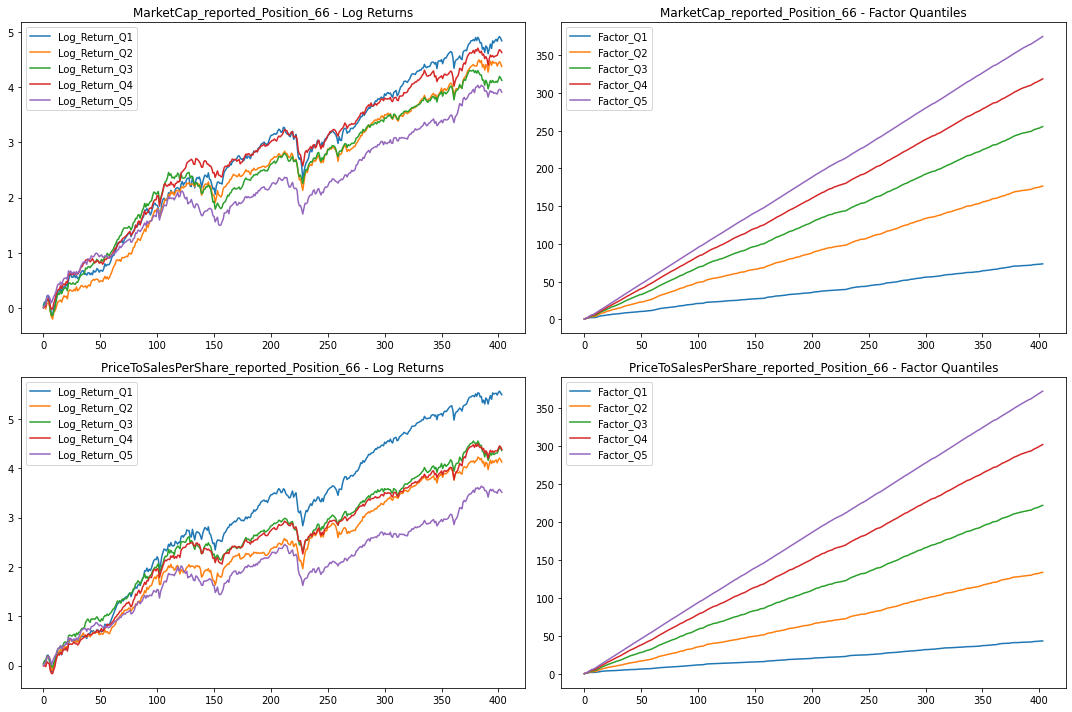
The charts below show Factor Statistics 1990 – 2023 for the 2 selected factors from the previous week.
Factor Statistics 2020 – 2023
| Top mover factor within the factor group | T-Stat | P-Value | Direction |
| MarketCap_reported_Position_66 | 0.4309 | 0.334 | +1.0 |
| PriceToSalesPerShare_reported_Position_66 | 0.3175 | 0.3762 | +1.0 |
In the table for the last 3 years, we can see that both factors had in the short-term opposite effect on the share price than in the whole long-term history!
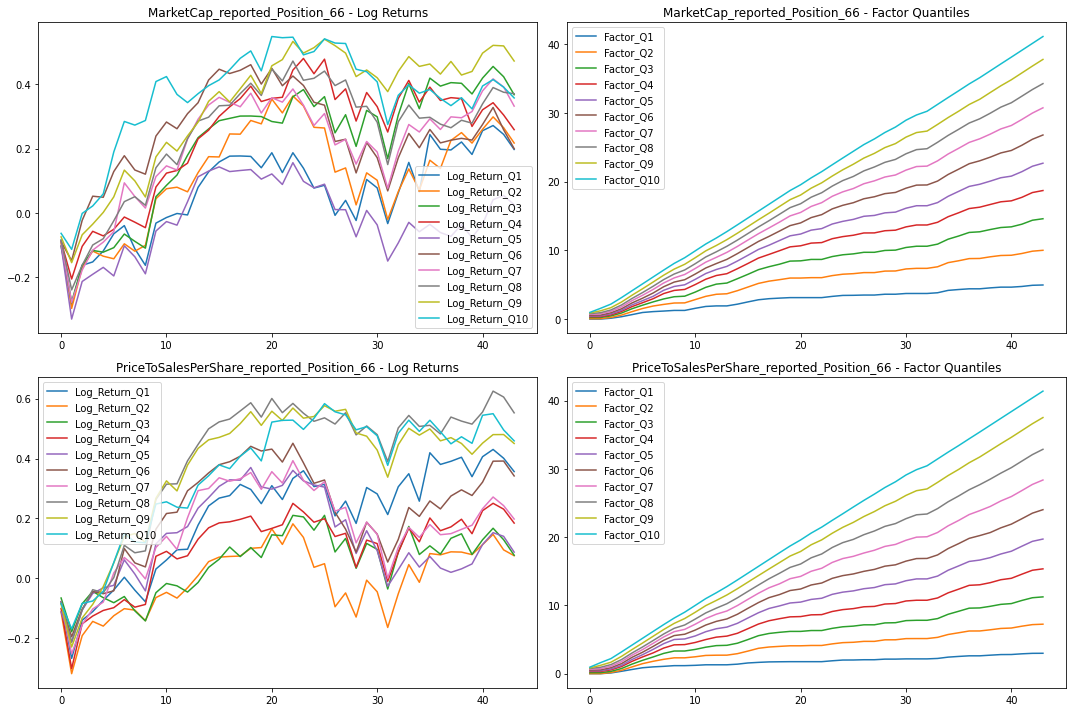
The charts below show Factor Statistics 2020 – 2023 for the 2 most moving factors from the previous week.
Factor Statistics Insights
Market Cap Position 66 – Although in the long run, there is around a 20% difference between Q1 and Q5 quantiles return, the P-value is a bit high, suggesting that the result is not statistically significant. This is nicely visible in the plots where quantiles lines haven’t been diverging and also other quantiles don’t perform as expected. For instance, Q4 worked better than Q1 for the majority of the time. In this case, the assumption is that the lower Market Cap brings better performance than the higher Market Cap, so Q1 is being used for Long positions and Q5 for short positions. It is aligned with the “size effect” as postulated in the Fama and French 5-factor model.
Price to Sales Per Share Position 66 – Regarding the second factor, we can observe stronger performance indicators. When we look at long-term performance, there’s a noticeable difference between the first quantile (Q1) and the fifth quantile (Q5). This indicates that the model can effectively distinguish between successful and less successful stocks over extended periods. However, we cannot observe any trend in the short term. This is connected with the high value of the P-value in this time period. To illustrate, the stocks with the lowest Price to Sales Per Share Position (Q1) grew slower than stocks with the highest Price to Sales Per Share (Q10), which is in conflict with the generally accepted financial theory.
In conclusion:
- The Market Cap Position 66 Factor didn’t perform well both in the long and the short term time frame.
- The Price to Sales Per Share Position reports stable values of P-Value in the long term. However, in the observed short-term period didn’t perform ideally. It was not wrong to use this factor for Long positions. The quantile with the lowest P/S achieved relatively good results. But the quantile with the highest price outperformed it, so shorting stocks from that quantile resulted in significant losses.
In this bulletin, we have shown the importance of the P-Value. For factors where its value is lower, we can better predict results. On the three-year time window, the P-Value was high for both factors, and therefore the long-term stable factor Price to Earnings per Share Position 66 did not perform as well as on the long time series.
Description of selected factors
Today, we’re going to delve into two selected trending factors of this week.
Market Cap Position 66 – Gauging Company Size:
Market Cap Position 66 is a financial indicator designed to assess the relative position of a company’s market capitalization within a specified historical range over a 66-day period.
It provides insights into how a company’s market capitalization compares to its recent historical values. Understanding a company’s size and its relative position within a specific time frame is crucial for investors and analysts.
A Low Market Cap Position 66 signifies that the current market capitalization is at the bottom of the historical range, while a High Market Cap Position 66 suggests that the current market capitalization is near the highest value observed within the 66-day window.
How can Market Cap Position 66 be used for assessing a company’s size and potential?
- A High Market Cap Position 66 may indicate a company’s high market cap in its historical range strength, suggesting that it’s difficult for it to grow more.
- Conversely, a Market Cap Position 66 significantly low may indicate relative that the company is still relatively small and there is still a lot of room to grow.
Price to Sales Per Share Position 66 – Assessing Valuation:
Price to Sales Per Share Position 66 is a financial indicator used to evaluate the P/S of a company within a 66-day time horizon.
This indicator helps investors understand whether a company’s stock price is expensive or not compared to the sales of the same company divided by the number of shares issued.
How can Price to Sales Per Share Position 66 be used for forecasting future prices?
- A high Price to Sales Per Share Position 66, suggests that the company’s stock is positioned relatively expensively compared to its sales per share over the 66-day period, potentially indicating an overvalued stock.
- Conversely, a low Price to Sales Per Share Position 66 suggests that the company’s stock is positioned favorably in terms of valuation compared to its sales per share within the specified time frame, potentially indicating an undervalued stock.