Trending Factors for AI-powered stock analysis (TAOTS 52nd week)

Trending Factors for AI-powered stock analysis (TAOTS 52nd week)
Greeting investors! Welcome to our first Newsletter in 2024, in which we take a look at the Trending Factors from the last week of 2023.
With the new year also comes changes in our newsletters.
- We will now only report on trending factors once a month. However, weekly and daily reports will be available in our app!
- We will also try to present the topic more humanely. Similar to the article, we introduce factor investing using the example of love.
So let’s delve into the world of factors from the previous week. Factors are the building blocks for AI-powered stock market analysis, stock picking, and creation of the robust investment strategies.
Introduction
We are assessing in detail six primary factors – Momentum, Quality, Size, Trend, Value, and Volatility for their significant development to short, mid, and long-term investment strategies. Read more about our 6-Factor (Groups) Investment Model.
Trending factors from last week
Based on the data for the 52nd week of 2023, we found that two specific factors for the week have notable changes – Momentum with a decrease of 17% and Quality with a decrease of 13%. The most notable movers have been Volume RSI 5 x within Momentum showcasing a massive growth of over 278% and OperatingCashFlow regular adj Change 66 under the Quality category marking a notable decrease of about 137%.
Description of selected factors
Volume RSI 5 (Momentum group of factors)
The top mover for momentum is Volume RSI 5 with a large positive change. The Relative Strength Index (RSI) is a momentum oscilator that measures the speed and change of price movements. It is primarily used to identify overbought or oversold conditions in a trading instrument. This surge implies a potential increase in price as market trends pick up pace.
OperatingCashFlow regular adj Change 66 (Quality group of factors)
The factor that moved most for the quality category is OperatingCashFlow regular adj Change 66 with a negative change. This metric assesses the quality of a company’s income by looking at the cash flow changes.
Invest in the forces that move stock prices
Leverage the power of factor investing with revolutionary software
Factor Statistics 26.12.2023 – 29.12.2023
| Top mover factor within the factor group | Mover value | Factor group | Group total value |
|---|---|---|---|
| Volume_RSI_5 | +2.7827 | momentum | -0.1684 |
| OperatingCashFlow_regular_adj_Change_66 | -1.3742 | quality | -0.1300 |
| Matlab_CurrencyVolumeRelChange_22vs44 | -2.2392 | size | +0.0374 |
| Volume_KAMA_3 | -0.3016 | trend | -0.0408 |
| PriceBookValueRatio_reported_Change_66 | +0.3245 | value | +0.0173 |
| AR1_LogPrice_5 | -1.7580 | volatility | -0.1214 |
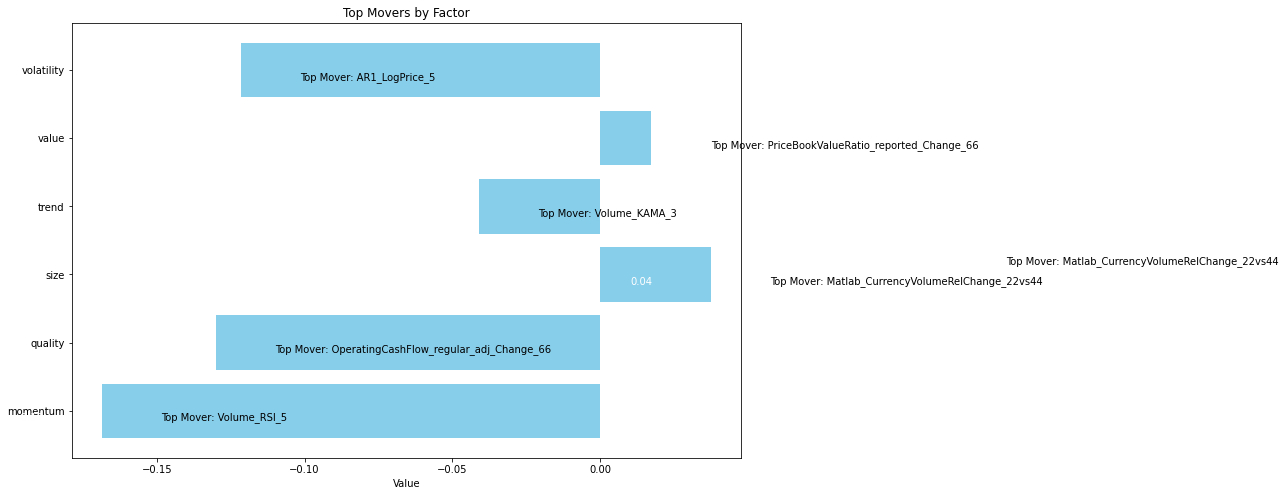
The figure shows the Top Movers across all the groups of factors we use in our analytics.
Let’s take a look at how traders who believed in the two most trending factors have fared in recent years
Statistics for factors
Factor Statistics 1990 – 2023
| Top mover factor within the factor group | T-Stat | P-Value | Direction |
|---|---|---|---|
| Volume_RSI_5 | +0.6561 | +0.2559 | +1.0 |
| OperatingCashFlow_regular_adj_Change_66 | +2.2308 | +0.0129 | +1.0 |
| Matlab_CurrencyVolumeRelChange_22vs44 | +1.3829 | +0.0834 | -1.0 |
| Volume_KAMA_3 | +0.5942 | +0.2762 | +1.0 |
| PriceBookValueRatio_reported_Change_66 | +0.1703 | +0.4324 | +1.0 |
| AR1_LogPrice_5 | +0.9321 | +0.1757 | -1.0 |
In the table, we can see the T-Stat and P-Value for the entire period of history for which we evaluate the factors, i.e. 1990 – 2023. The Direction value shows the direction in which the factor affects the movement of the share price, +1 expresses the positive impact of the increasing factor on the share price, and -1 expresses the negative impact of the increasing value of the factor on the share price. In simple terms of theory, we can say that a T-statistic that is greater than 2.0 or less than -2.0 is statistically significant; and if the P-value is less than 0.05, we reject the null hypothesis and say that we found a statistically significant effect.
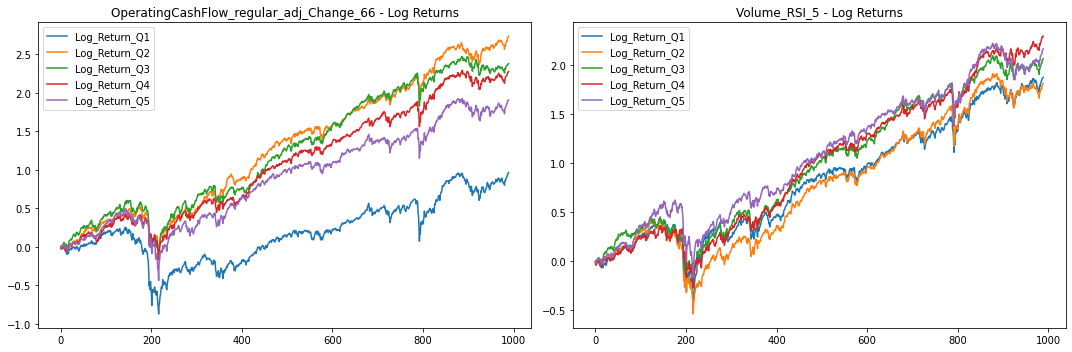
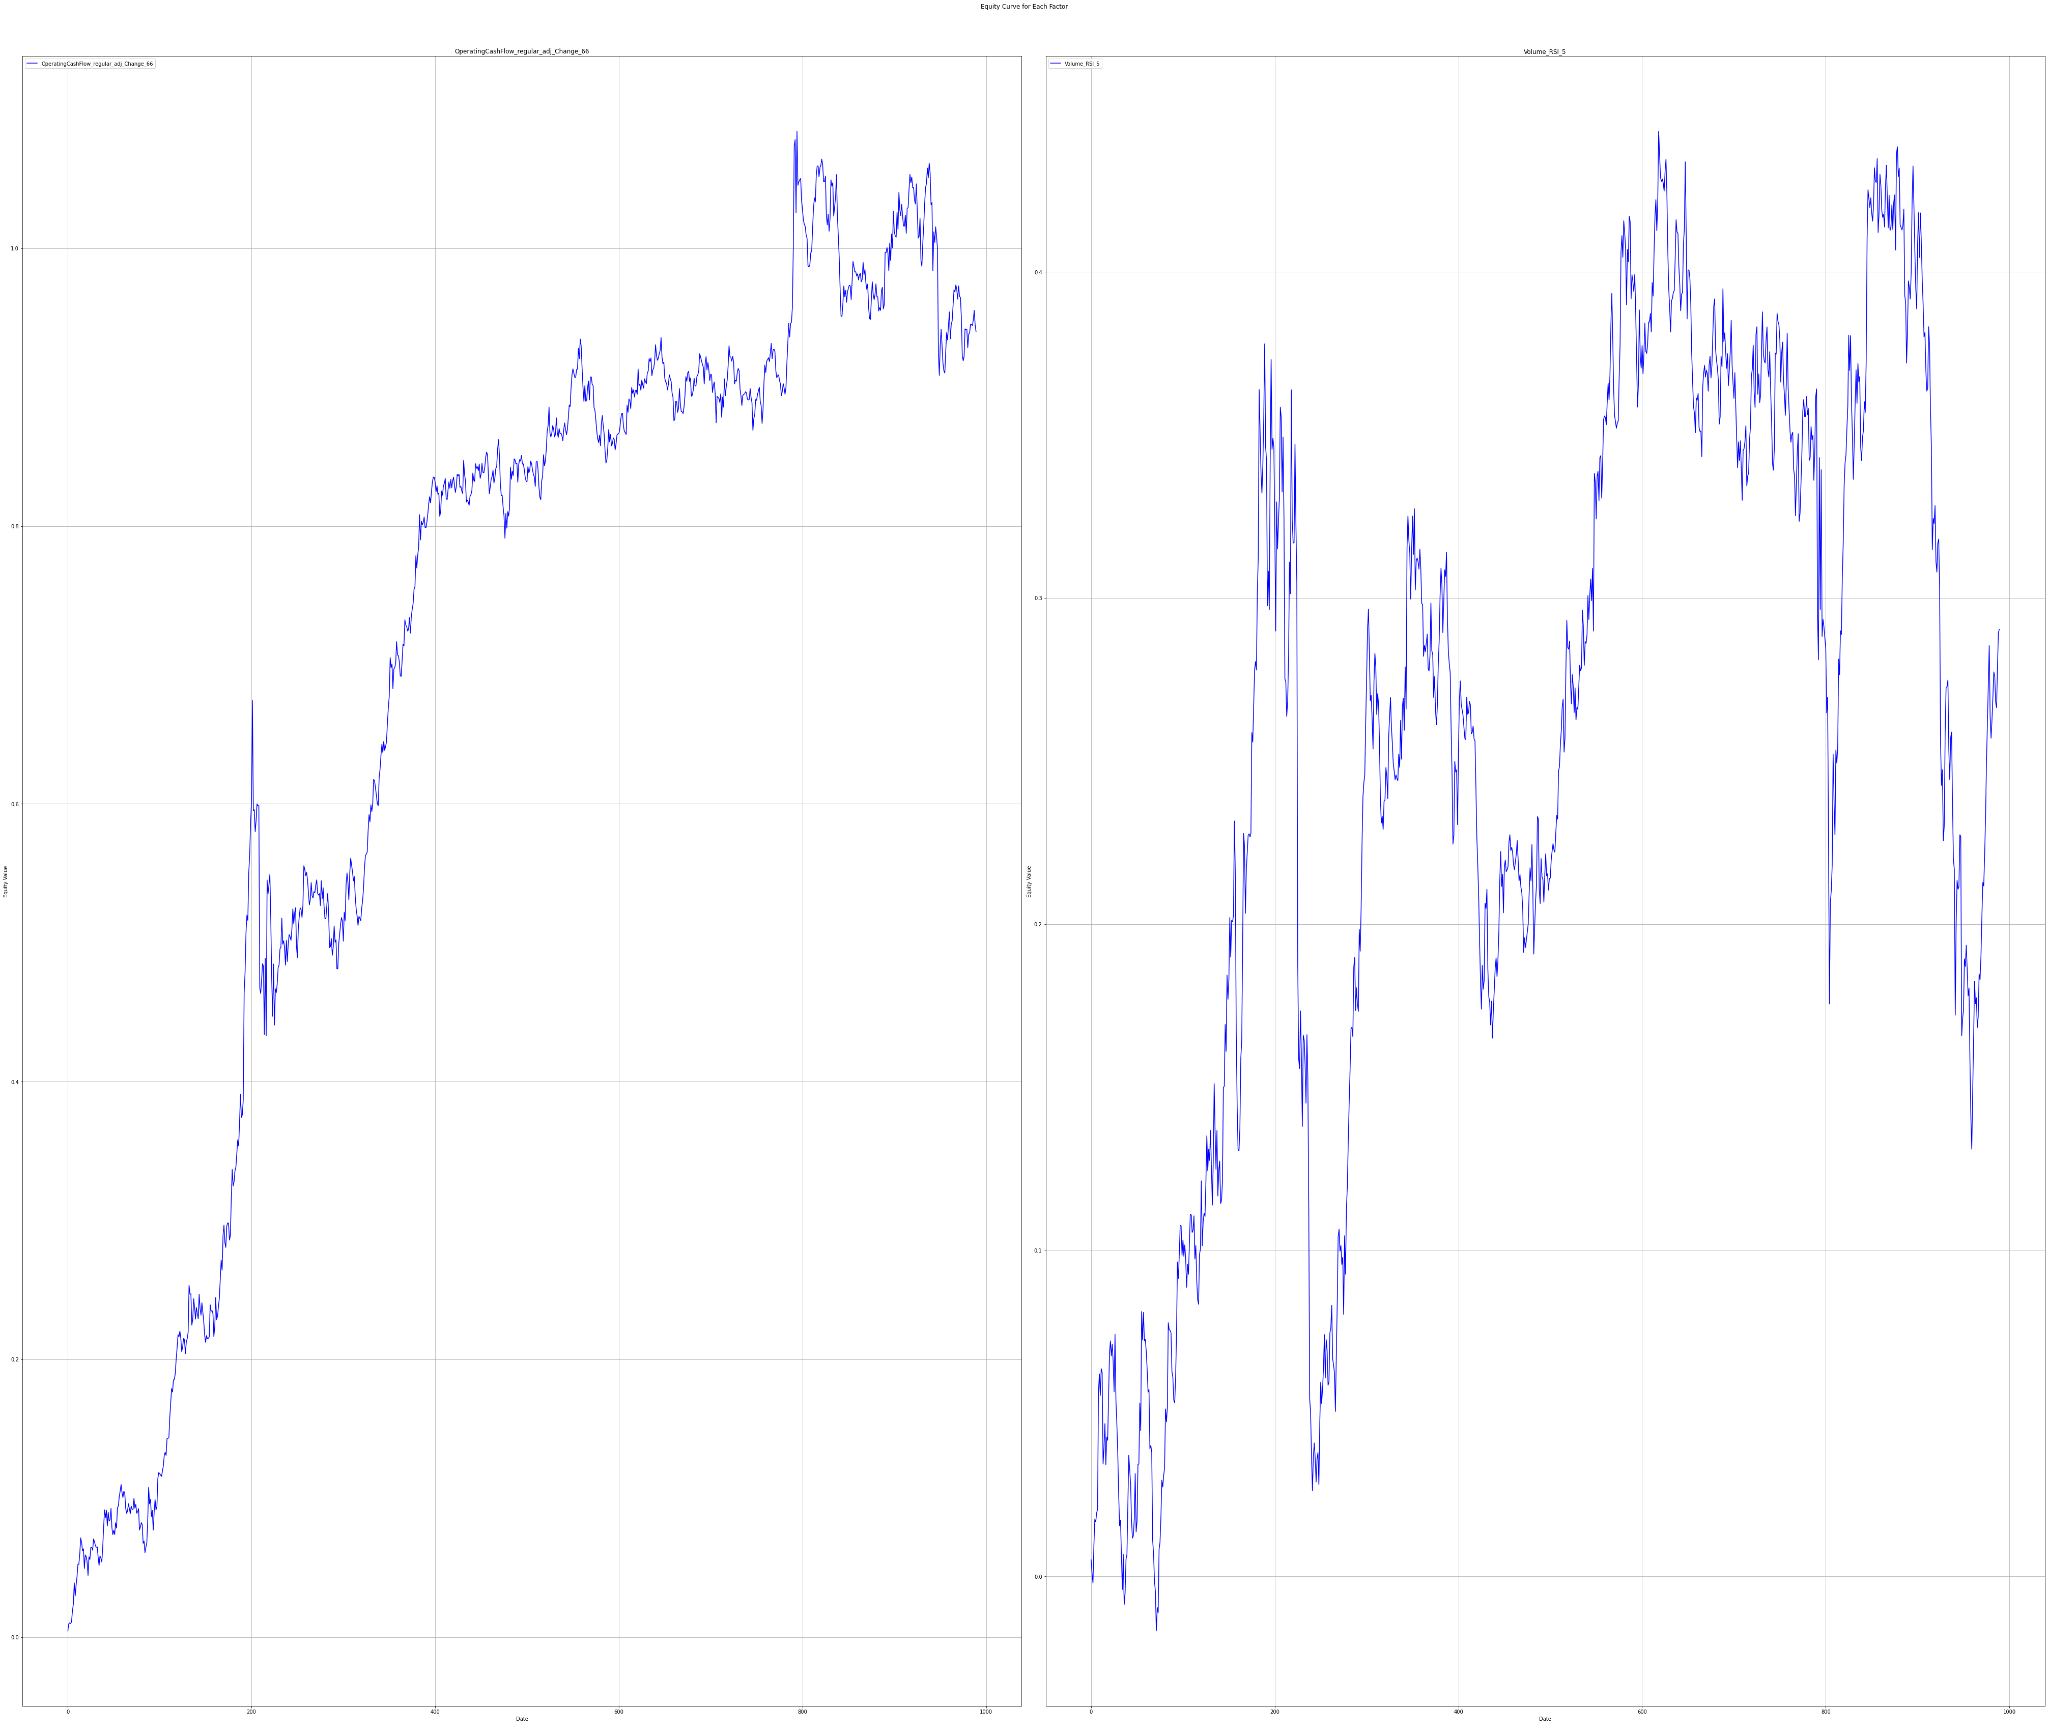
To understand the performance of these factors, we delve into their long-only portfolios based on quantiles, and long-short portfolio returns. The five quantiles (Q1-Q5) divide the data into equal parts according to the respective factor value, creating a picture of distribution across the portfolios. Investors usually target Q1 or Q5 portfolios of a factor, depending on whether the higher or lower value of the factor is expected to outperform.
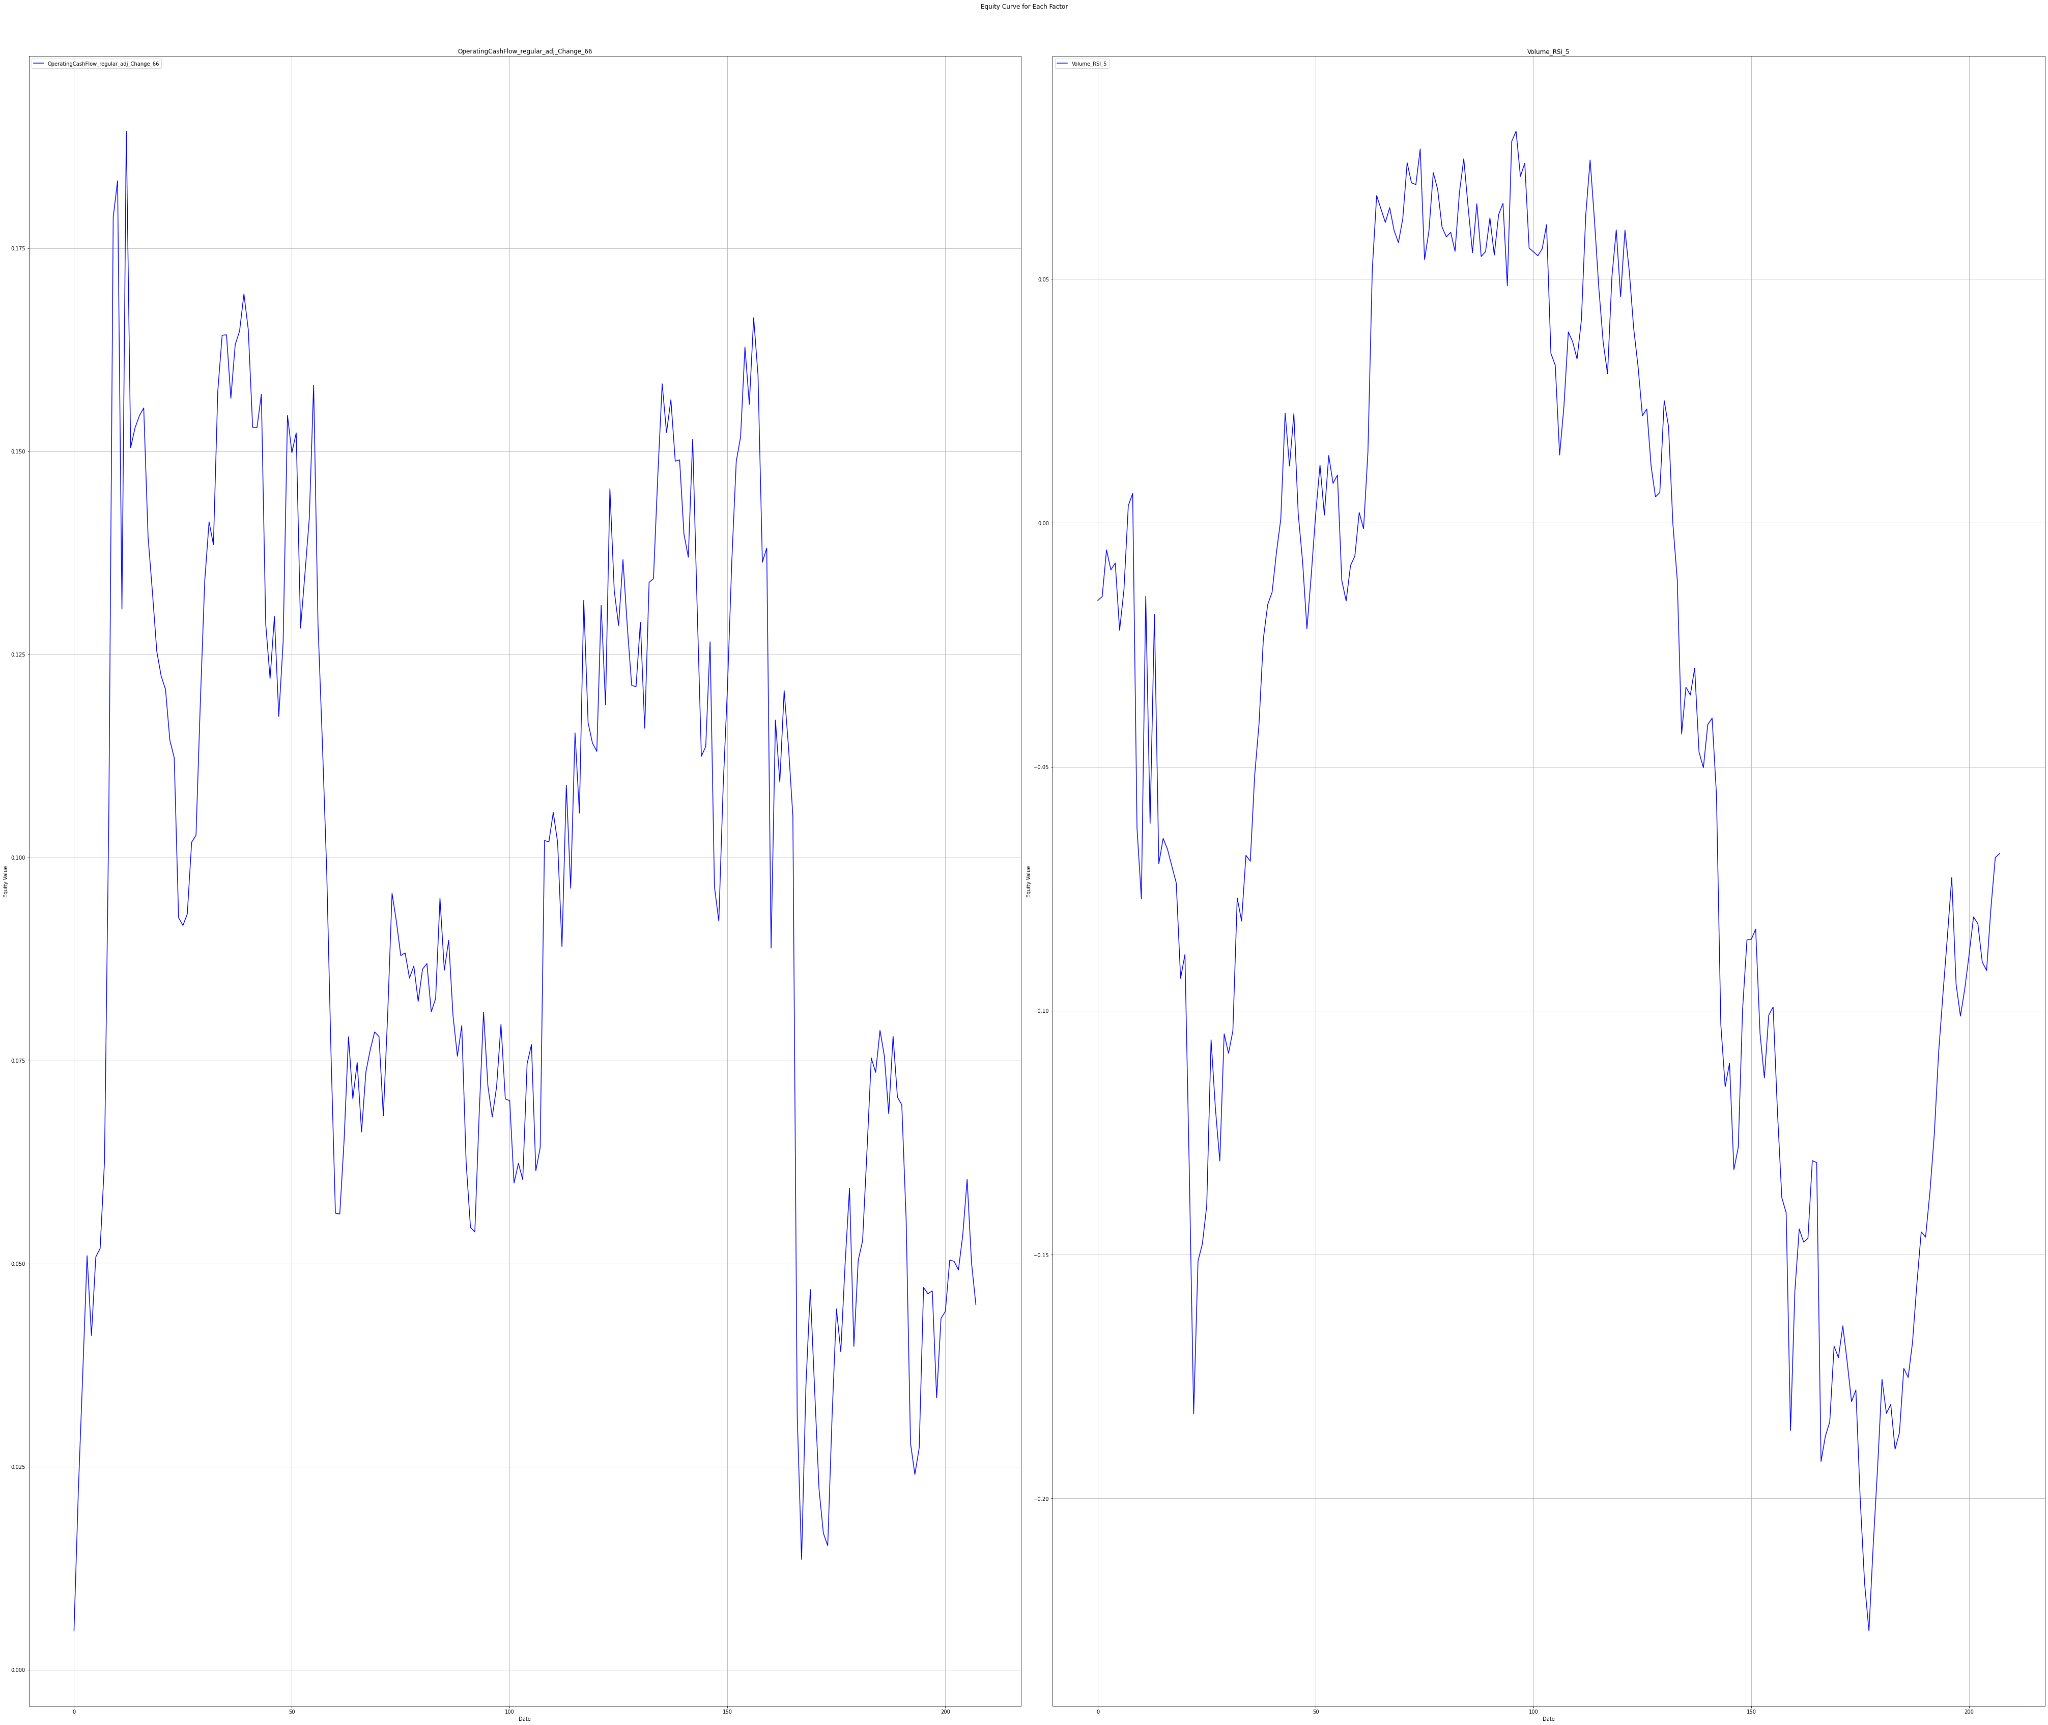
The charts below show Factor Statistics 1990 – 2023 for the 2 selected factors from the previous week.
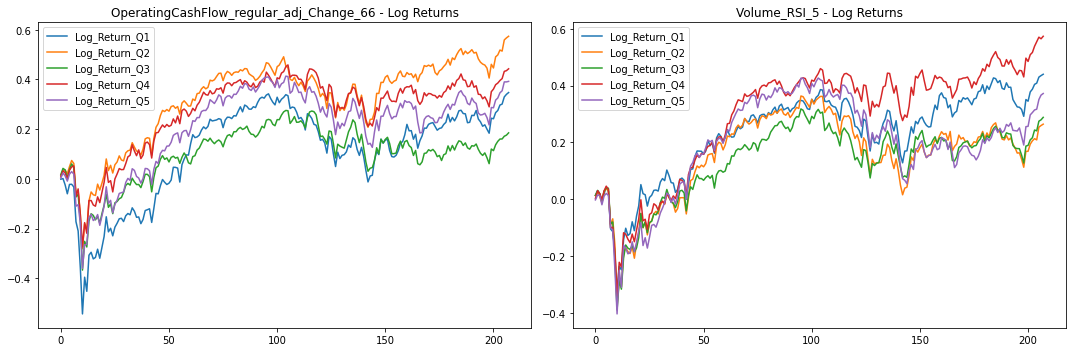
While the next one shows the behavior of the factors in the last 3 years.
Factor Statistics 2020 – 2023
| Top mover factor within the factor group | T-Stat | P-Value | Direction |
|---|---|---|---|
| Volume_RSI_5 | -0.2804 | +0.6102 | -1.0 |
| OperatingCashFlow_regular_adj_Change_66 | +0.2008 | +0.4205 | +1.0 |
| Matlab_CurrencyVolumeRelChange_22vs44 | -0.8579 | +0.8040 | -1.0 |
| Volume_KAMA_3 | +0.7797 | +0.2182 | +1.0 |
| PriceBookValueRatio_reported_Change_66 | +1.3384 | +0.0911 | +1.0 |
| AR1_LogPrice_5 | -0.3125 | +0.6225 | -1.0 |
The charts below show Factor Statistics 2020 – 2023 for the 2 selected factors from the previous week.
Factor Statistics Insights
We can notice an interesting paradox in the current statistics. The P-Value and T-Stat values come out very well and as statistically significant for the factor OperatingCashFlow regular adj Change 66. However, if we look at the chart of Factor Statistics 1990 – 2023, we see that Q1 may have performed the worst, but Q5, which should have been the best, was the second worst. Thus, if we were to invest in stocks with median values for that factor, we would achieve significantly better results than if we invested in the quintile with the best values. The factor comes out statistically significant because the test only takes the difference between Q5 and Q1 and if the value is different from 0, the P-Value comes out small. As can be seen from the graph, the difference between these two quantiles is still large.
The Volume RSI factor of 5 comes out as statistically insignificant even over a long period. This is beautifully evident from both tables, graphs showing the performance of individual quantiles, and the performance of the long-short portfolio.
Using factors in AI Stock Analysis
Our AI-powered StockPicking Lab is built on the factor investing approach combined with machine learning. We say that the most effective way to use AI to find the most undervalued stocks is to look for factors that influence stock price movements before matching appropriate stocks to them.
- In the first step, we focus on understanding the relationship between the high/low value of the factor under study for the stocks under consideration and the price movement of these stocks.
- Subsequently, we evaluate statistical significance using the P-value and T-statistic to select only the significant factors that we use to build the stock valuation model. There is no AI involved so far. However, this step already eliminates the basic problem of analysts evaluating stocks based on statistically insignificant factors and indicators.
These two points are the focus of our regular TAOTS. - In the next step, we can stack (ideally uncorrelated) factors into our model. This is where AI-based stock analysis comes in, as machine learning and its state-of-the-art methods should be used to select the best-performing uncorrelated factors and build robust stock strategies that work in most market situations. These investment strategies are what the StockPicking Lab provides. Read more in the article Stock Analysis with The Power of AI.