Trending Factors for AI-powered stock analysis (TAOTS 1st Month of 2024)

Trending Factors for AI-powered stock analysis (TAOTS 1st Month of 2024)
Greeting investors! Welcome to our second Newsletter in 2024, in which we take a look at the Trending Factors from the first month of 2024. Factors are the building blocks for AI-powered stock market analysis, stock picking, and creation of the robust investment strategies.
Introduction
We are assessing in detail six primary factors – Momentum, Quality, Size, Trend, Value, and Volatility for their significant development to short, mid, and long-term investment strategies. Read more about our 6-Factor (Groups) Investment Model.
Trending factors from last month
Data presented for the most apparent factors for the month showcases some dramatic percentage changes (month-on-month). The two factors that commanded our attention were: ’Volume Position 22’ from the ’Momentum’ category which showed an increase of 776.54%, and ’Variance 5’ from the ’Volatility’ category which jumped by a hefty 863.28%.
Description of selected factors
Volume Position 22 (Momentum group of factors)
In trading terms, volume refers to the number of shares or contracts that point towards thorough trading activity within a given period. Specifically, ’Volume Position 22 ’ represents a 22-day moving average volume computation. This metric is used to smooth out daily trading volumes to a certain extent, revealing the underlying momentum of trading activity. A higher ’Volume Position 22 ’ could mean an intensified trading interest in the stock, often a prelude to significant price moves.
Variance 5 (Volatility group of factors)
’Variance 5 ’ accounts for the dispersion from the average return over the past 5 days. In layman’s terms, it measures how far a stock’s price swings. Investors use ’Variance 5 ’, as a volatility measurement to predict the range in which a stock price is likely to move. This month’s notable surge signifies an increase in price movement and therefore, a rise in the potential for both, risks and opportunities.
Invest in the forces that move stock prices
Leverage the power of factor investing with revolutionary software
Factor Statistics 01.01.2024 – 31.01.2024
| Top mover factor within the factor group | Mover value | Factor group | Group total value |
|---|---|---|---|
| Volume_Position_22 | +7.7653 | momentum | -0.3913 |
| CapExAssets_Change_66 | -0.7526 | quality | -0.1178 |
| CurrencyVolumeAbsChange_5vs66 | -1.5653 | size | -0.3544 |
| Volume_WMA_2 | +0.9720 | trend | +0.0880 |
| DividendYield_Position_66 | +1.7076 | value | +0.0105 |
| Variance_5 | +8.6328 | volatility | +0.0118 |
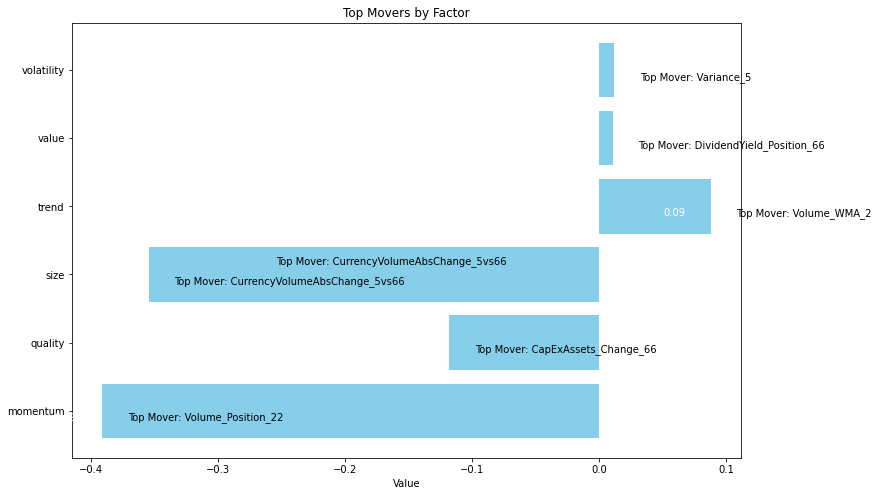
The figure shows the Top Movers across all the groups of factors we use in our analytics.
Let’s take a look at how traders who believed in the two most trending factors have fared in recent years
Statistics for factors
Factor Statistics 1990 – 2024
| Top mover factor within the factor group | T-Stat | P-Value | Direction |
|---|---|---|---|
| Volume_Position_22 | +1.0603 | +0.1450 | -1.0 |
| CapExAssets_Change_66 | +0.6407 | +0.2611 | -1.0 |
| CurrencyVolumeAbsChange_5vs66 | +0.1259 | +0.4499 | +1.0 |
| Volume_WMA_2 | +1.3450 | +0.0899 | +1.0 |
| DividendYield_Position_66 | +0.6466 | +0.2592 | +1.0 |
| Variance_5 | +0.2764 | +0.3912 | +1.0 |
In the table, we can see the T-Stat and P-Value for the entire period of history for which we evaluate the factors, i.e. 1990 – 2024. The Direction value shows the direction in which the factor affects the movement of the share price, +1 expresses the positive impact of the increasing factor on the share price, and -1 expresses the negative impact of the increasing value of the factor on the share price. In simple terms of theory, we can say that a T-statistic that is greater than 2.0 or less than -2.0 is statistically significant; and if the P-value is less than 0.05, we reject the null hypothesis and say that we found a statistically significant effect.
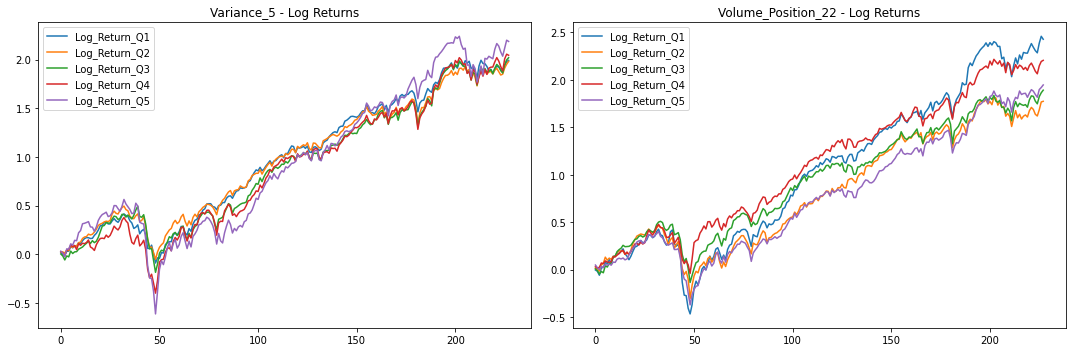
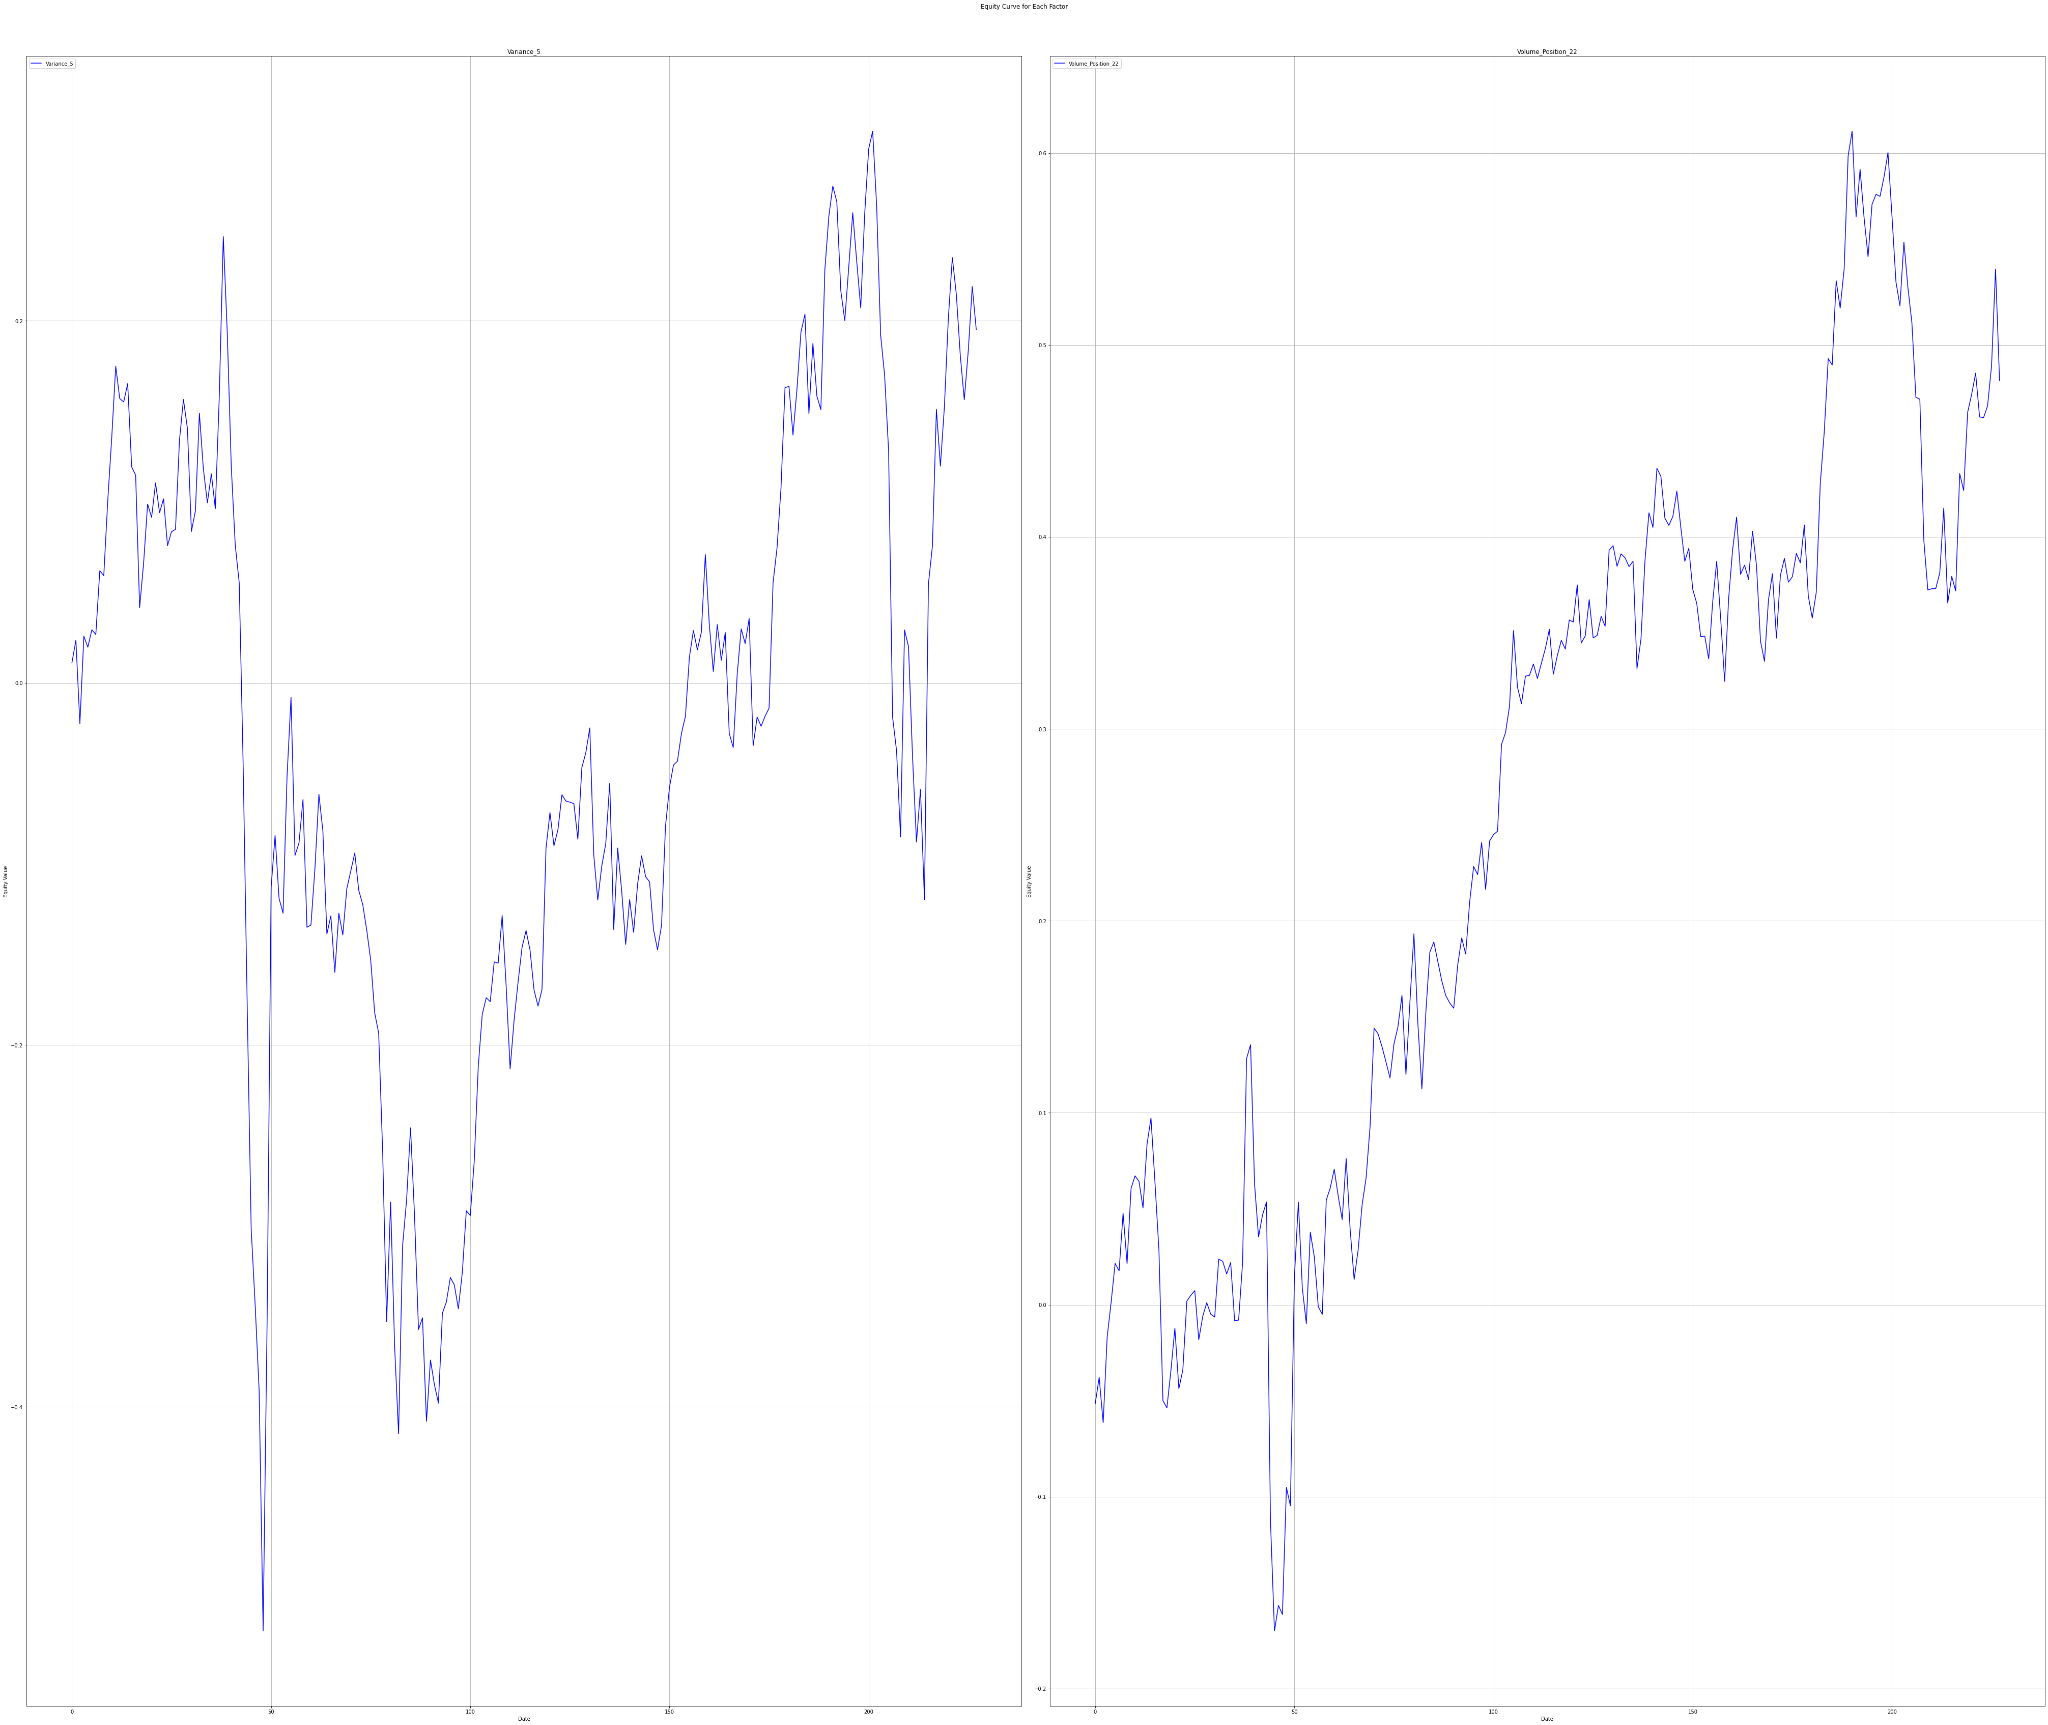
To understand the performance of these factors, we delve into their long-only portfolios based on quantiles, and long-short portfolio returns. The five quantiles (Q1-Q5) divide the data into equal parts according to the respective factor value, creating a picture of distribution across the portfolios. Investors usually target Q1 or Q5 portfolios of a factor, depending on whether the higher or lower value of the factor is expected to outperform.
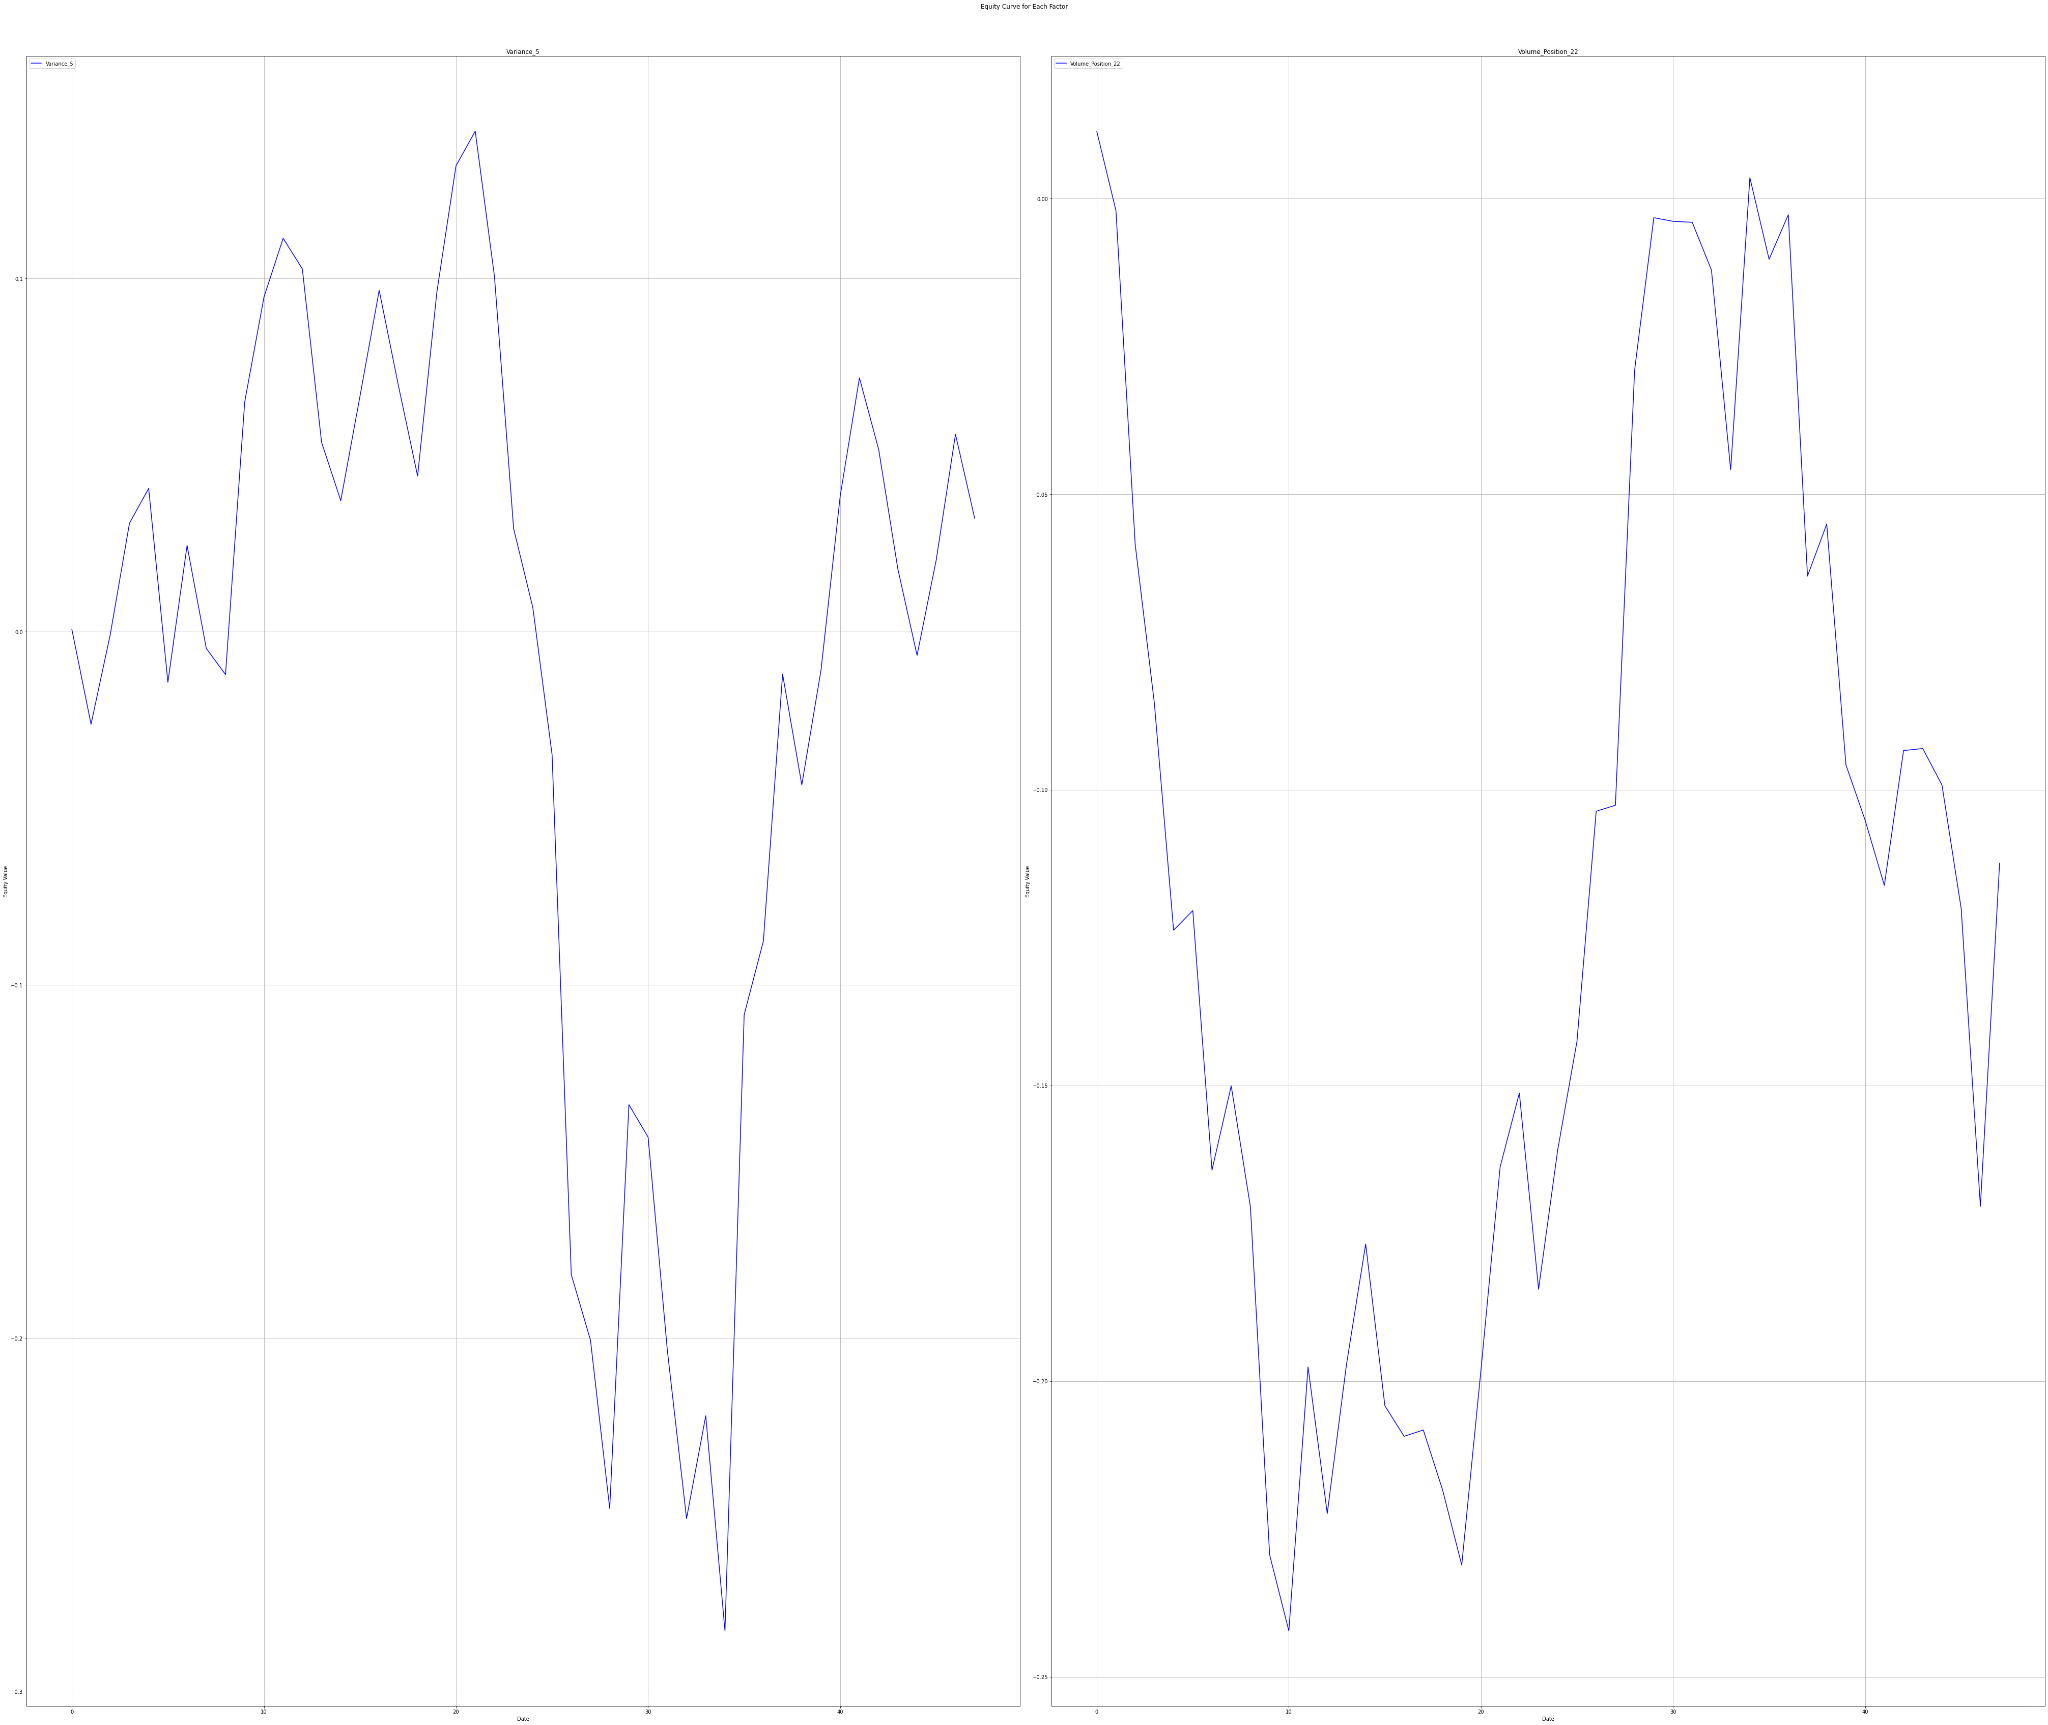
The charts below show Factor Statistics 1990 – 2024 for the 2 selected factors from the previous month.
While the next one shows the behavior of the factors in the last 4 years.
Factor Statistics 2020 – 2024
| Top mover factor within the factor group | T-Stat | P-Value | Direction |
|---|---|---|---|
| Volume_Position_22 | -0.5254 | +0.6991 | -1.0 |
| CapExAssets_Change_66 | -0.4225 | +0.6627 | -1.0 |
| CurrencyVolumeAbsChange_5vs66 | -0.1353 | +0.5535 | -1.0 |
| Volume_WMA_2 | +0.7769 | +0.2205 | +1.0 |
| DividendYield_Position_66 | -0.4719 | +0.6804 | -1.0 |
| Variance_5 | +0.0884 | +0.4649 | +1.0 |
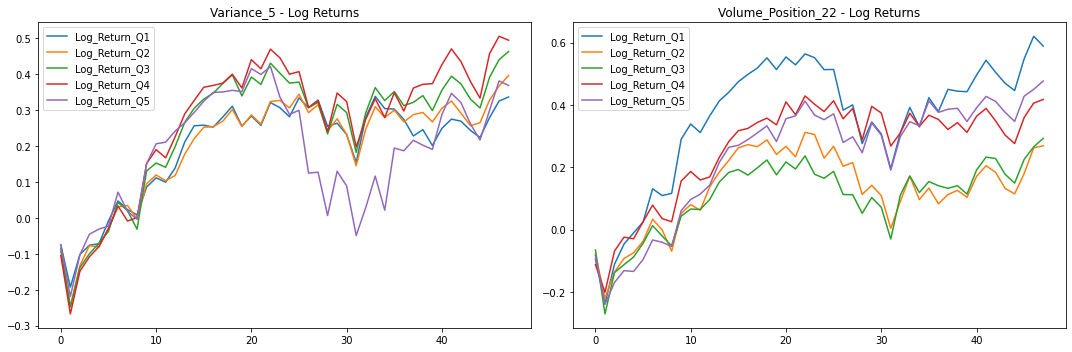
The charts below show Factor Statistics 2020 – 2024 for the 2 selected factors from the previous month.
Factor Statistics Insights
From the T-Stat values we can see that the most trending factors are not highly statistically significant. This is reflected in the results we can see in the graphs shown. However, if users were to invest in the stock with the lowest value at Volume Position 22, they would perform the best in all periods examined, which exhibits an appealing pattern.
Do you want to invest in statistically significant factors that work over the long term? Try our Factor Investing app.
Using factors in AI Stock Analysis
Our AI-powered StockPicking Lab is built on the factor investing approach combined with machine learning. We say that the most effective way to use AI to find the most undervalued stocks is to look for factors that influence stock price movements before matching appropriate stocks to them.
- In the first step, we focus on understanding the relationship between the high/low value of the factor under study for the stocks under consideration and the price movement of these stocks.
- Subsequently, we evaluate statistical significance using the P-value and T-statistic to select only the significant factors that we use to build the stock valuation model. There is no AI involved so far. However, this step already eliminates the basic problem of analysts evaluating stocks based on statistically insignificant factors and indicators.
These two points are the focus of our regular TAOTS. - In the next step, we can stack (ideally uncorrelated) factors into our model. This is where AI-based stock analysis comes in, as machine learning and its state-of-the-art methods should be used to select the best-performing uncorrelated factors and build robust stock strategies that work in most market situations. These investment strategies are what the StockPicking Lab provides. Read more in the article Stock Analysis with The Power of AI.