The AP on the Street Annual Summary – Trending Factors in 2023

The AP on the Street Annual Summary – Trending Factors in 2023
Welcome all to our annual summary edition of the AP on the Street newsletter. This time around, instead of the usual weekly inventory, we’re taking a broader perspective, examining what moved the markets (Trending Factors) throughout the year 2023.
Introduction
We’ll delve into the world of factor investing and focus on six factors: Momentum, Quality, Size, Trend, Value, and Volatility. Read more about our 6-Factor (Groups) Investment Model.
In particular, we will go in-depth and focus on two notable factors that stood out this past year and the specific movers connected to these factors. Our goal here is to provide insights that will help our investing community understand the forces that sway stock prices and how they can use these trends to make informed investment decisions. Note, however, that all figures here are presented as year-over-year percentage changes to give a more comprehensive view of the market trends and forces at play.
Trending factors from last year
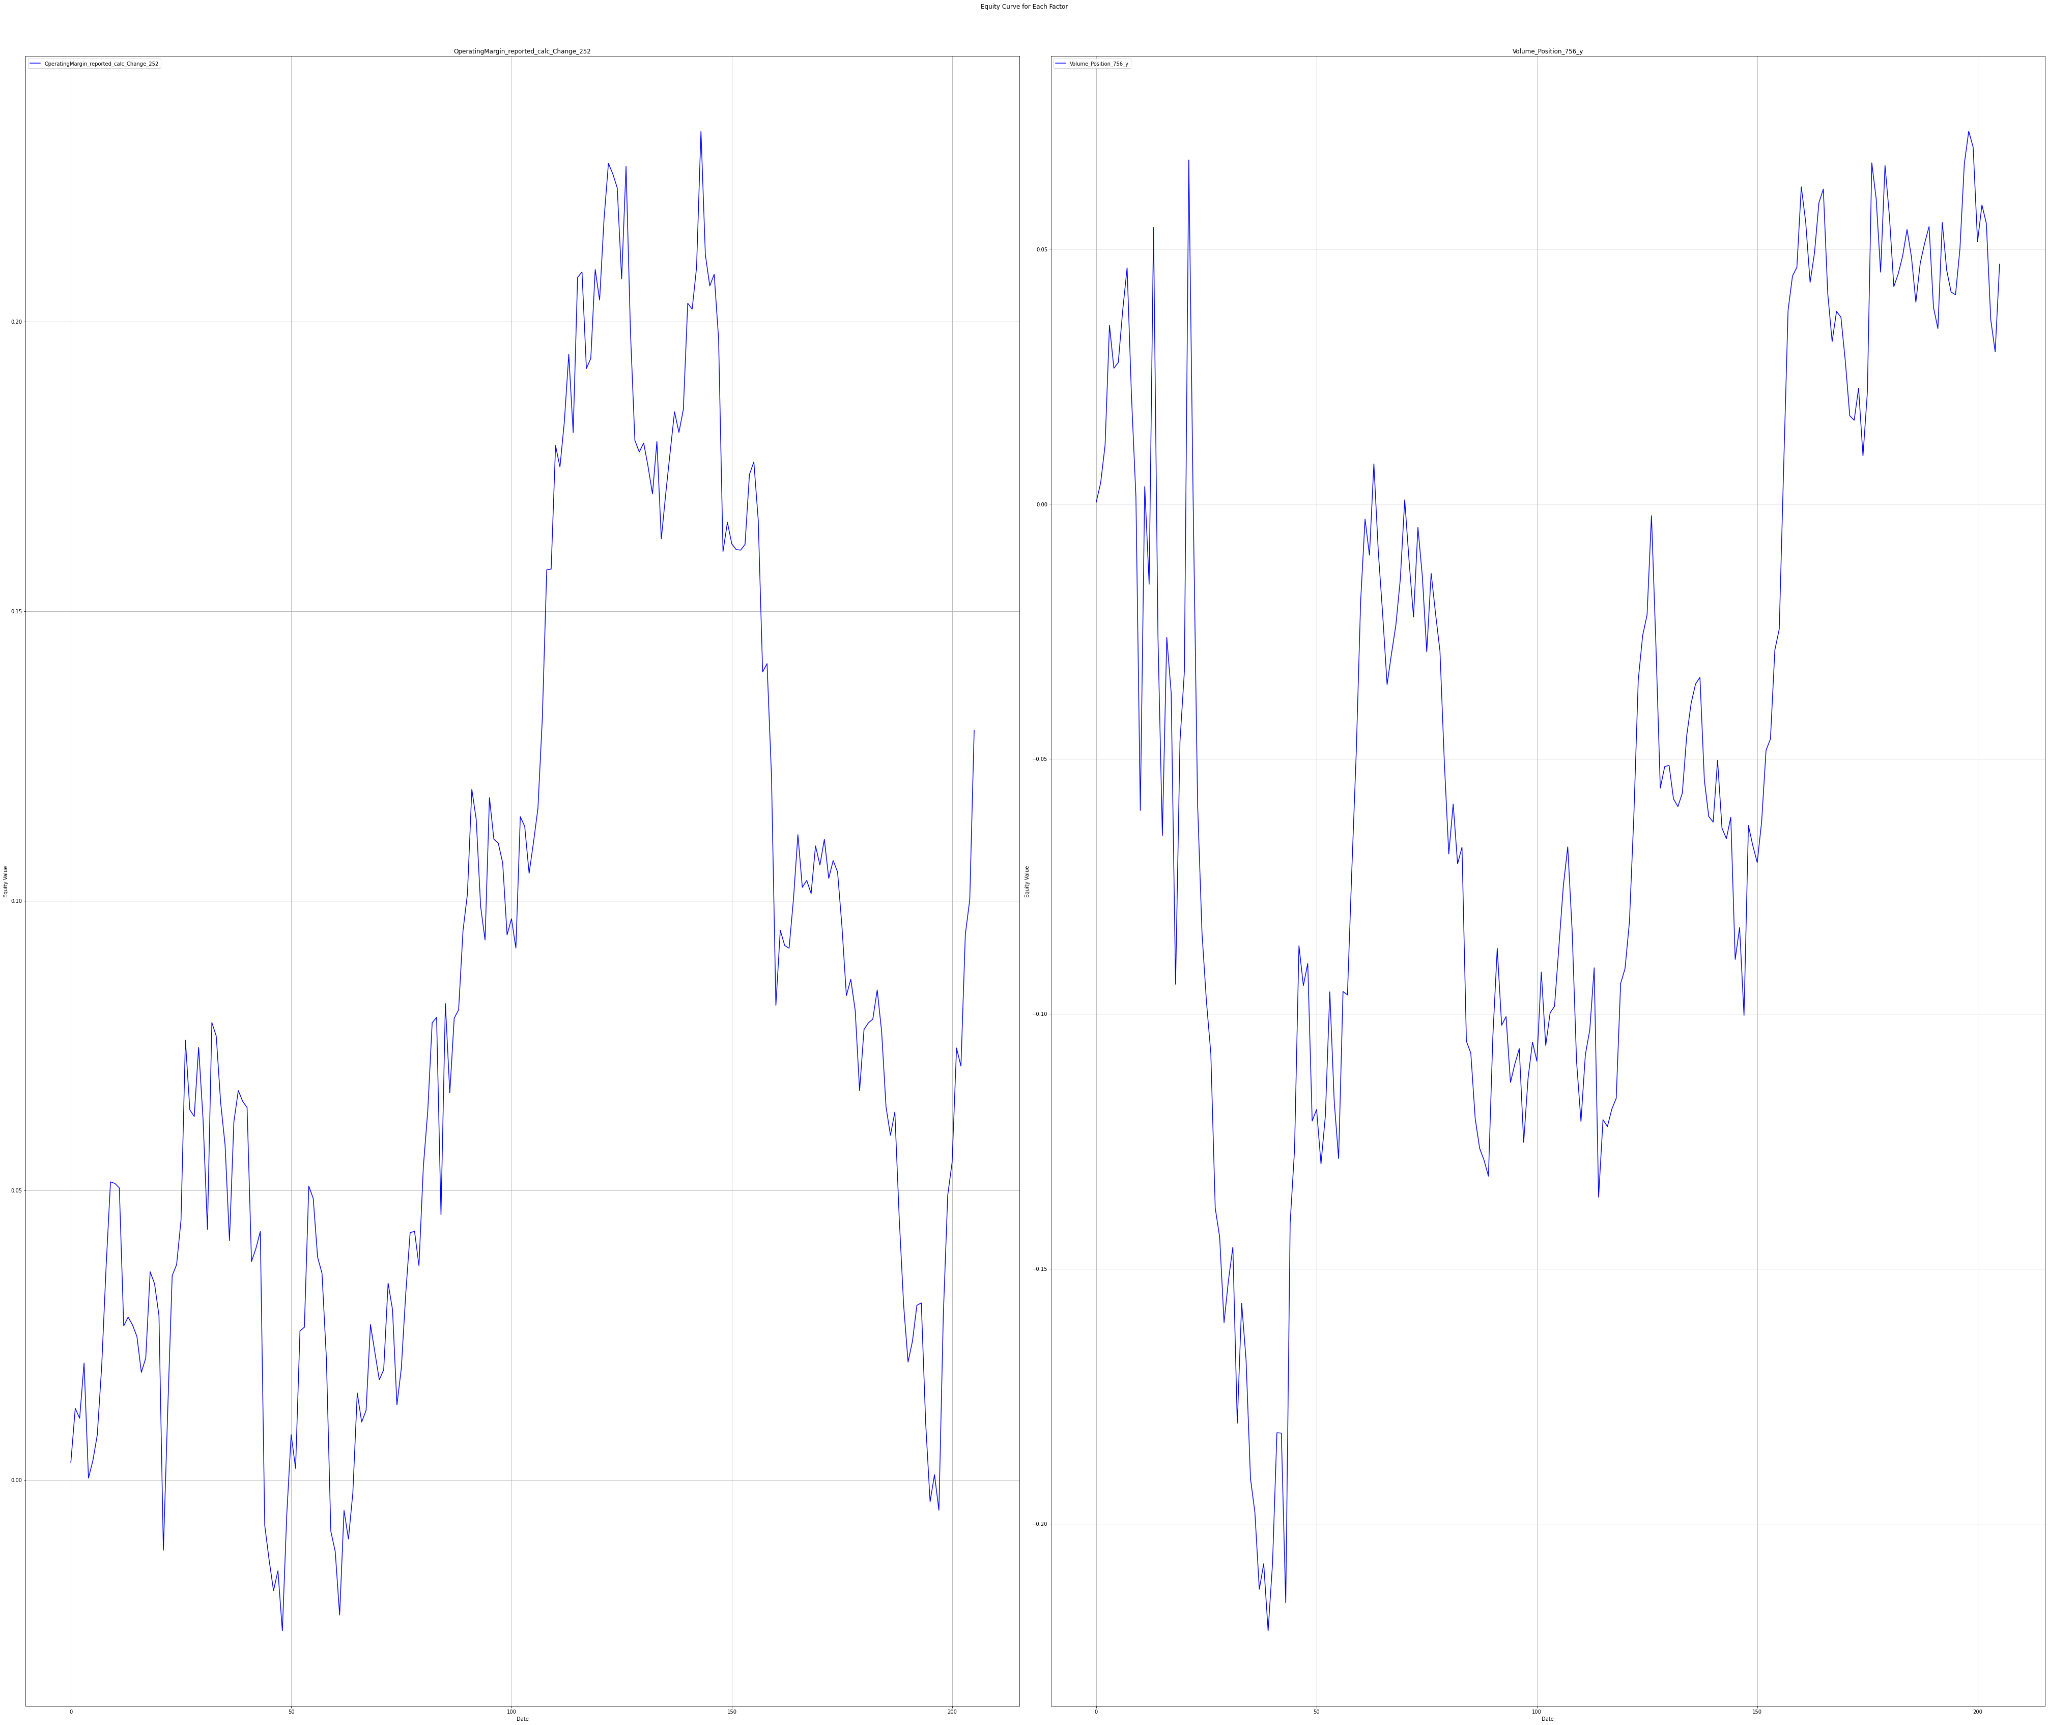
For this time, we will highlight two specific features: Volume Position 756 y affiliated with the ‘momentum’ factor and OperatingMargin reported calc Change 252 affiliated with the ‘quality’ factor.
Description of selected factors
Volume Position 756 y (Momentum group of factors)
This feature refers to the position of a security’s trading volume over the last 756 trading days. A rise in trading volumes often signals a surge in the momentum of a stock. Why does this matter? Increased buying or selling activity can lead to significant price movements.
Volume Position 756 y experienced a notable 1242% YoY change.
OperatingMargin reported calc Change 252 (Quality group of factors)
In essence, it measures the YoY change in the operating margins of a company for the last 252 days. This feature indicates the firm’s operational efficiency and its ability to turn revenues into profits, both crucial qualities for long-term investors.
OperatingMargin reported calc Change 252 witnessed a 228% increase over the same period.
Invest in the forces that move stock prices
Leverage the power of factor investing with revolutionary software
Factor Statistics in 2023
| Top mover factor within the factor group | Mover value | Factor group | Group total value |
|---|---|---|---|
| Volume_Position_756_y | +12.4240 | momentum | +0.6428 |
| OperatingMargin_reported_calc_Change_252 | +2.2818 | quality | +0.5362 |
| CurrencyVolume_1 | +2.7193 | size | +0.6831 |
| Volume_WMA_2 | +2.1950 | trend | +0.1466 |
| PriceToSalesPerShare_reported_Position_252 | +2.3265 | value | +0.1739 |
| Variance_5 | +2.3784 | volatility | +0.3069 |
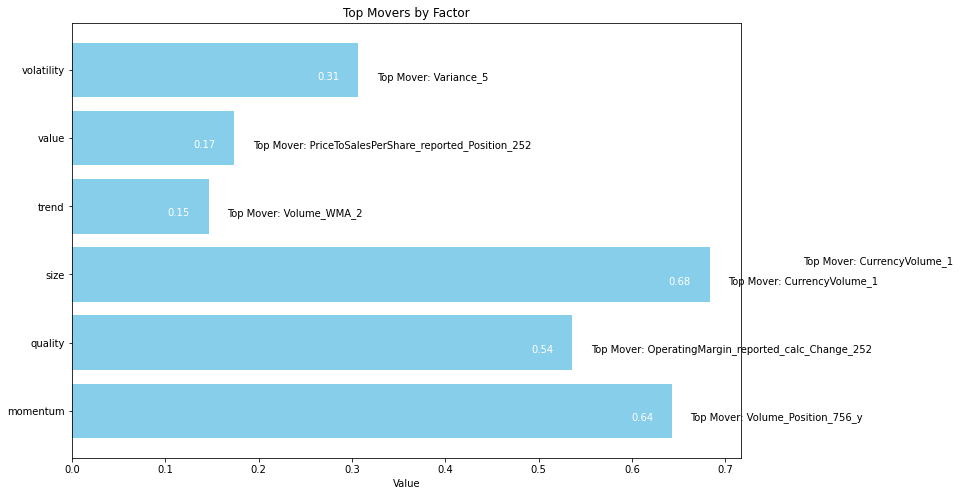
The figure shows the Top Movers across all the groups of factors we use in our analytics.
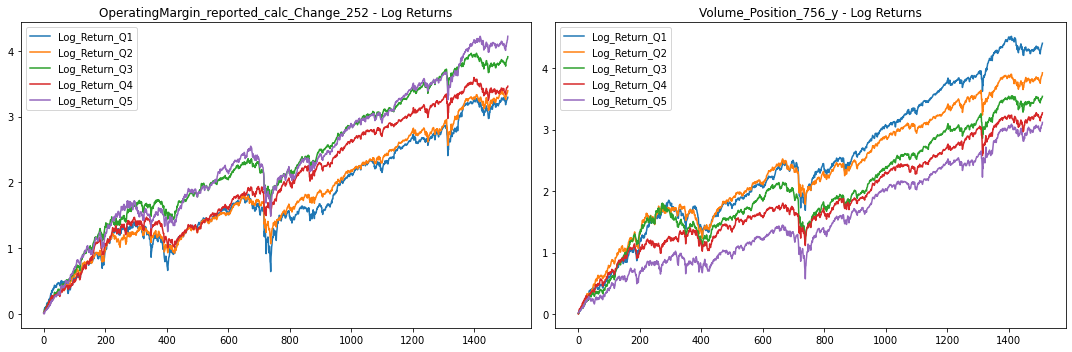
Let’s take a look at how traders who believed in the two most trending factors have fared in recent years
Statistics for factors
Factor Statistics 1990 – 2023
| Top mover factor within the factor group | T-Stat | P-Value | Direction |
|---|---|---|---|
| Volume_Position_756_y | +1.8374 | +0.0331 | -1.0 |
| OperatingMargin_reported_calc_Change_252 | +1.4570 | +0.0726 | +1.0 |
| CurrencyVolume_1 | +3.0336 | +0.0012 | -1.0 |
| Volume_WMA_2 | +1.5140 | +0.0651 | +1.0 |
| PriceToSalesPerShare_reported_Position_252 | +3.5008 | +0.0002 | -1.0 |
| Variance_5 | +0.0506 | +0.4797 | -1.0 |
In the table, we can see the T-Stat and P-Value for the entire period of history for which we evaluate the factors, i.e. 1990 – 2023. The Direction value shows the direction in which the factor affects the movement of the share price, +1 expresses the positive impact of the increasing factor on the share price, and -1 expresses the negative impact of the increasing value of the factor on the share price. In simple terms of theory, we can say that a T-statistic that is greater than 2.0 or less than -2.0 is statistically significant; and if the P-value is less than 0.05, we reject the null hypothesis and say that we found a statistically significant effect.
To understand the performance of these factors, we delve into their long-only portfolios based on quantiles, and long-short portfolio returns. The five quantiles (Q1-Q5) divide the data into equal parts according to the respective factor value, creating a picture of distribution across the portfolios. Investors usually target Q1 or Q5 portfolios of a factor, depending on whether the higher or lower value of the factor is expected to outperform.
The charts below show Factor Statistics from 1990 – 2023 for the 2 selected factors.
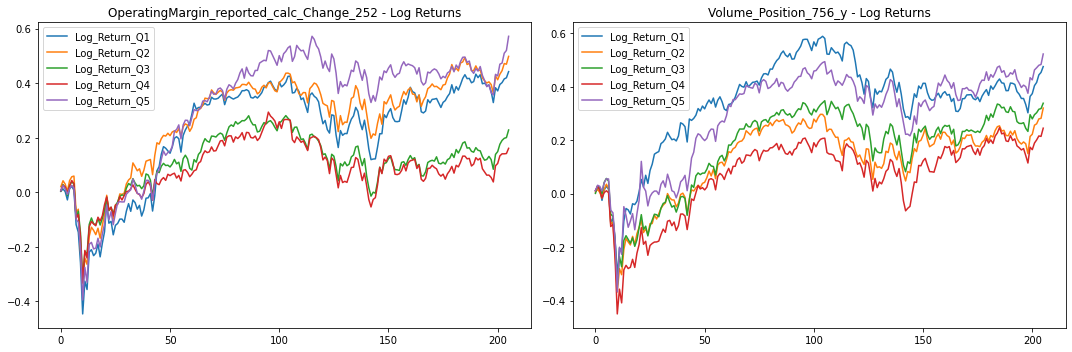
While the next one shows the behavior of the factors in the last 3 years.
Factor Statistics 2020 – 2023
| Top mover factor within the factor group | T-Stat | P-Value | Direction |
|---|---|---|---|
| Volume_Position_756_y | +0.1502 | +0.4403 | +1.0 |
| OperatingMargin_reported_calc_Change_252 | +0.6378 | +0.2621 | +1.0 |
| CurrencyVolume_1 | +0.3808 | +0.3518 | +1.0 |
| Volume_WMA_2 | +0.8263 | +0.2047 | +1.0 |
| PriceToSalesPerShare_reported_Position_252 | -0.7063 | +0.7596 | -1.0 |
| Variance_5 | +0.1681 | +0.4333 | +1.0 |
The charts below show Factor Statistics 2020 – 2023 for the 2 selected factors from the previous week.
Factor Statistics Insights
Statistical metrics and performance metrics show how these factors performed in ‘long-only’ portfolios and “long-short” portfolio returns. Examining quantile portfolios over the period from 1990 to 2023 and long-short portfolios between 2020 and 2023 we can see that selected factors performed exceptionally well in ‘long-only’ portfolios.
From the data about quantile portfolios for the period 1990-2023, it’s noticeable that Q5 (top quintile – stocks with the highest factor values) portrayed a higher Log_Return compared to Q1 (bottom quintile – stocks with the lowest factor values) for both factors. This shows that the performance increases as the strength of the factor increases. This is an important aspect demonstrating the capacity of factor investing to unveil profitable opportunities.
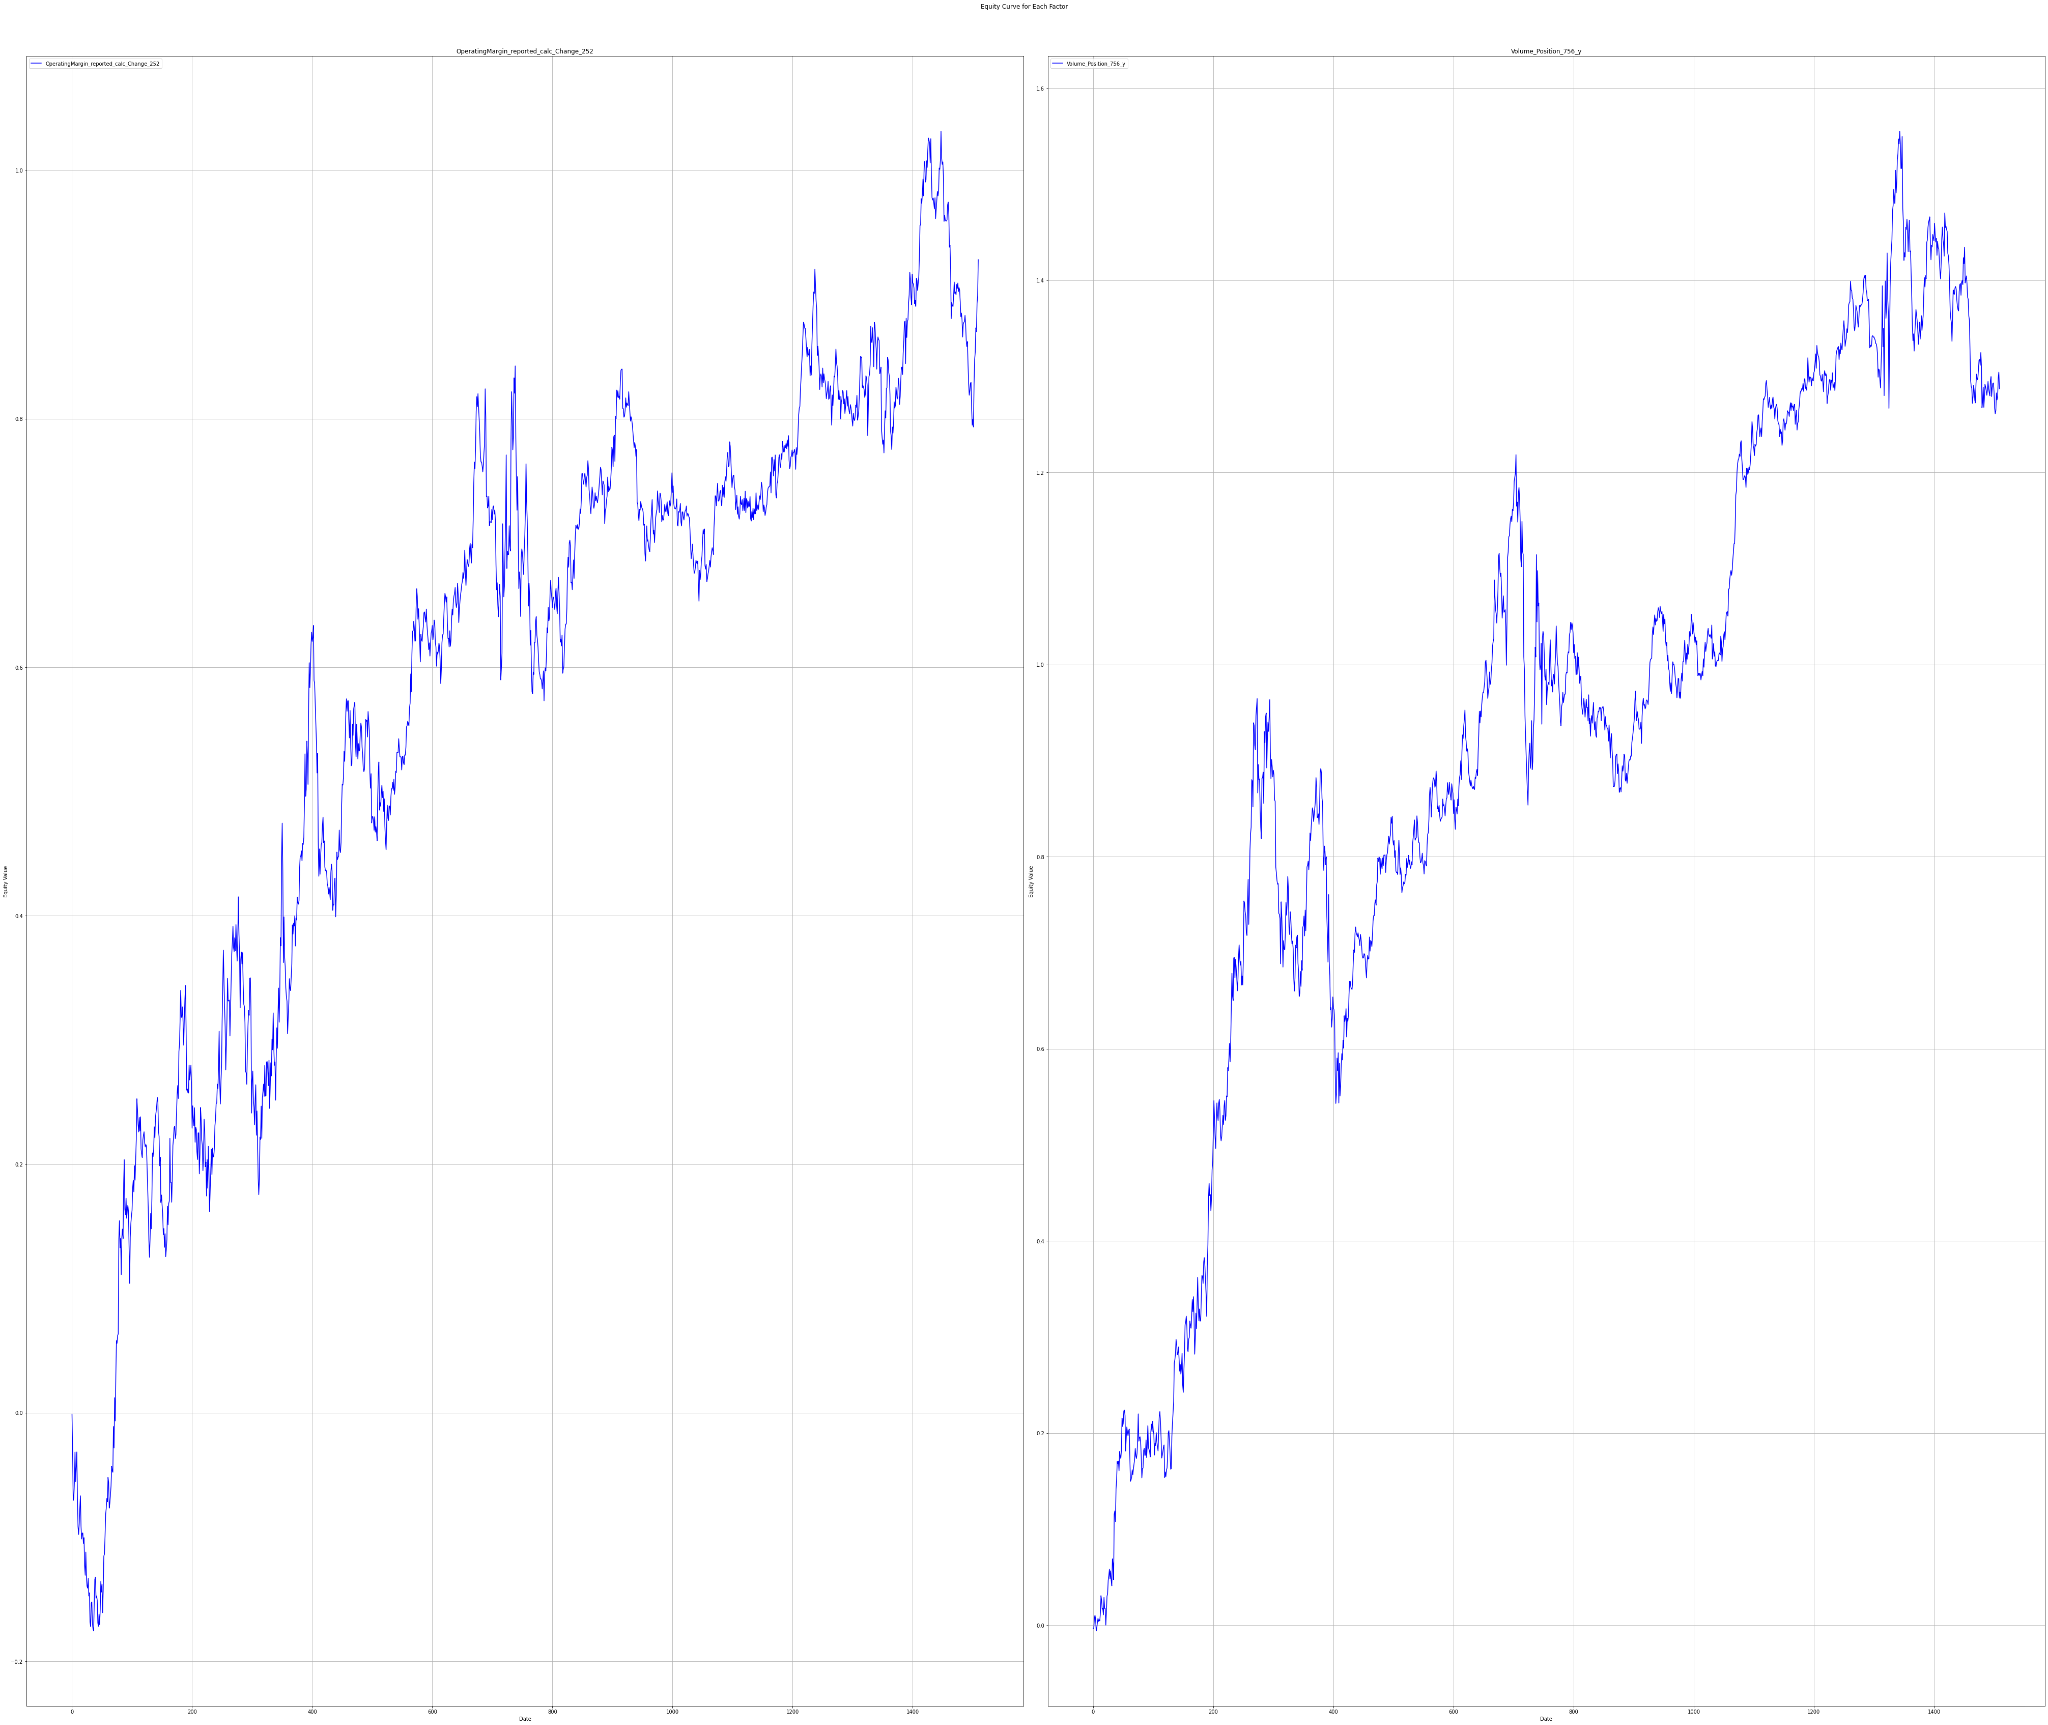
The statistical t-tests conducted on the long-short portfolios provide evidence of the predictive power of factor `Volume_Position_756_y` factor. For the long-term period (We adjust the portfolio once a month. Therefore, 36 rebalances/observations are recorded over a three-year horizon, which is a questionable/borderline number for calculating the short-term statistical significance of the indicators), this factor showed a statistically significant t-stat (with a p-value less than 0.05). OperatingMargin reported calc Change 252 is slightly above the desired threshold. However, in the case of Volume_Position_756_y, the best performance in the short term was exactly the opposite quantile to that in the long term. Thus, according to the analytics, there is a change in the direction of movement that the factor is exerting on the price. Despite that, the best-performing quantile in the long run is just behind the quantile in the short run, so it can be considered a useful predictor for ‘long-only’ portfolios.
As we move forward, factor performance will inevitably evolve, which is why we’ll continue bringing you updates on the pulse of the stock market. Until next year, here’s to mindful investing!
Using factors in AI Stock Analysis
Our AI-powered StockPicking Lab is built on the factor investing approach combined with machine learning.
- In the first step, we focus on understanding the relationship between the high/low value of the factor under study for the stocks under consideration and the price movement of these stocks.
- Subsequently, we evaluate statistical significance using the P-value and T-statistic to select only the significant factors that we use to build the stock valuation model. There is no AI involved so far. However, this step already eliminates the basic problem of analysts evaluating stocks based on statistically insignificant factors and indicators.
These two points are the focus of our regular TAOTS. - In the next step, we can stack (ideally uncorrelated) factors into our model. This is where AI-based stock analysis comes in, as machine learning and its state-of-the-art methods should be used to select the best-performing uncorrelated factors and build robust stock strategies that work in most market situations. These investment strategies are what the StockPicking Lab provides. Read more in the article Stock Analysis with The Power of AI.