The AP on the Street 50th week of 2023 – Trending Factors

The AP on the Street 50th week of 2023 – Trending Factors
Welcome, dear readers to our weekly roundup for the 50th week of 2023 (11.12.2023 – 15.12.2023) in our ongoing series dedicated to providing intricate insights into the latest movements, trends, and predictions in stock market trends concerning Factor Investing.
Introduction
We are assessing in detail six primary factors – Momentum, Quality, Size, Trend, Value, and Volatility for their significant development to short, mid, and long-term investment strategies. Read more about our 6-Factor (Groups) Investment Model.
Trending factors from last week
Based on the data for the 50th week of 2023, we found that two specific factors for the week have notable changes – Momentum with a decrease of 25.27% and Trend with an increase of 9.19%. The most notable movers have been Volume CMO 252 x within Momentum showcasing a massive reduction of over 504.68% and Volume WMA 2 under the Trend category marking a notable increase of about 108.90%.
Description of selected factors
Volume CMO 252 x (Momentum group of factors)
Momentum has been one of the vital elements of our weekly analysis, and the Volume CMO 252 x, which is based on the Chande Momentum Oscillator calculated for 252 trading days, has shown a significant decrease. It measures Momentum, a gauge of the speed or velocity of price changes. It’s a valuable indicator used to capture potential reversals in price as it could indicate overbought or oversold market conditions.
Volume WMA 2 (Trend group of factors)
Similarly, another key factor that’s been trending this week is Trend, particularly following the Volume WMA 2 indicator. The Weighted Moving Average (WMA) gives more importance to recent prices than older prices to make the indicator more sensitive to current market conditions, giving investors a more timely insight into emerging trends.
Invest in the forces that move stock prices
Leverage the power of factor investing with revolutionary software
Factor Statistics 11.12.2023 – 15.12.2023
| Top mover factor within the factor group | Mover value | Factor group | Group total value |
|---|---|---|---|
| Volume_CMO_252_x | -5.0468 | momentum | -0.2527 |
| CapExToMarketCap_reported_Position_66 | -0.2355 | quality | -0.0033 |
| CurrencyVolumeAbsChange_5vs10 | -2.0891 | size | +0.0241 |
| Volume_WMA_2 | +1.0889 | trend | +0.0919 |
| PriceEarningsRatio_reported_calc_Position_66 | +0.1991 | value | +0.0487 |
| Variance_5 | +2.7789 | volatility | -0.0076 |
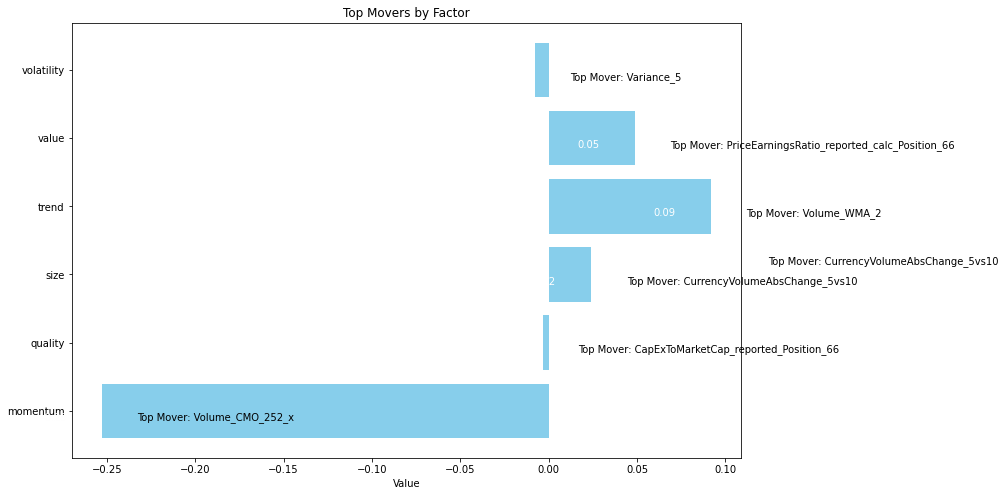
The figure shows the Top Movers across all the groups of factors we use in our analytics.
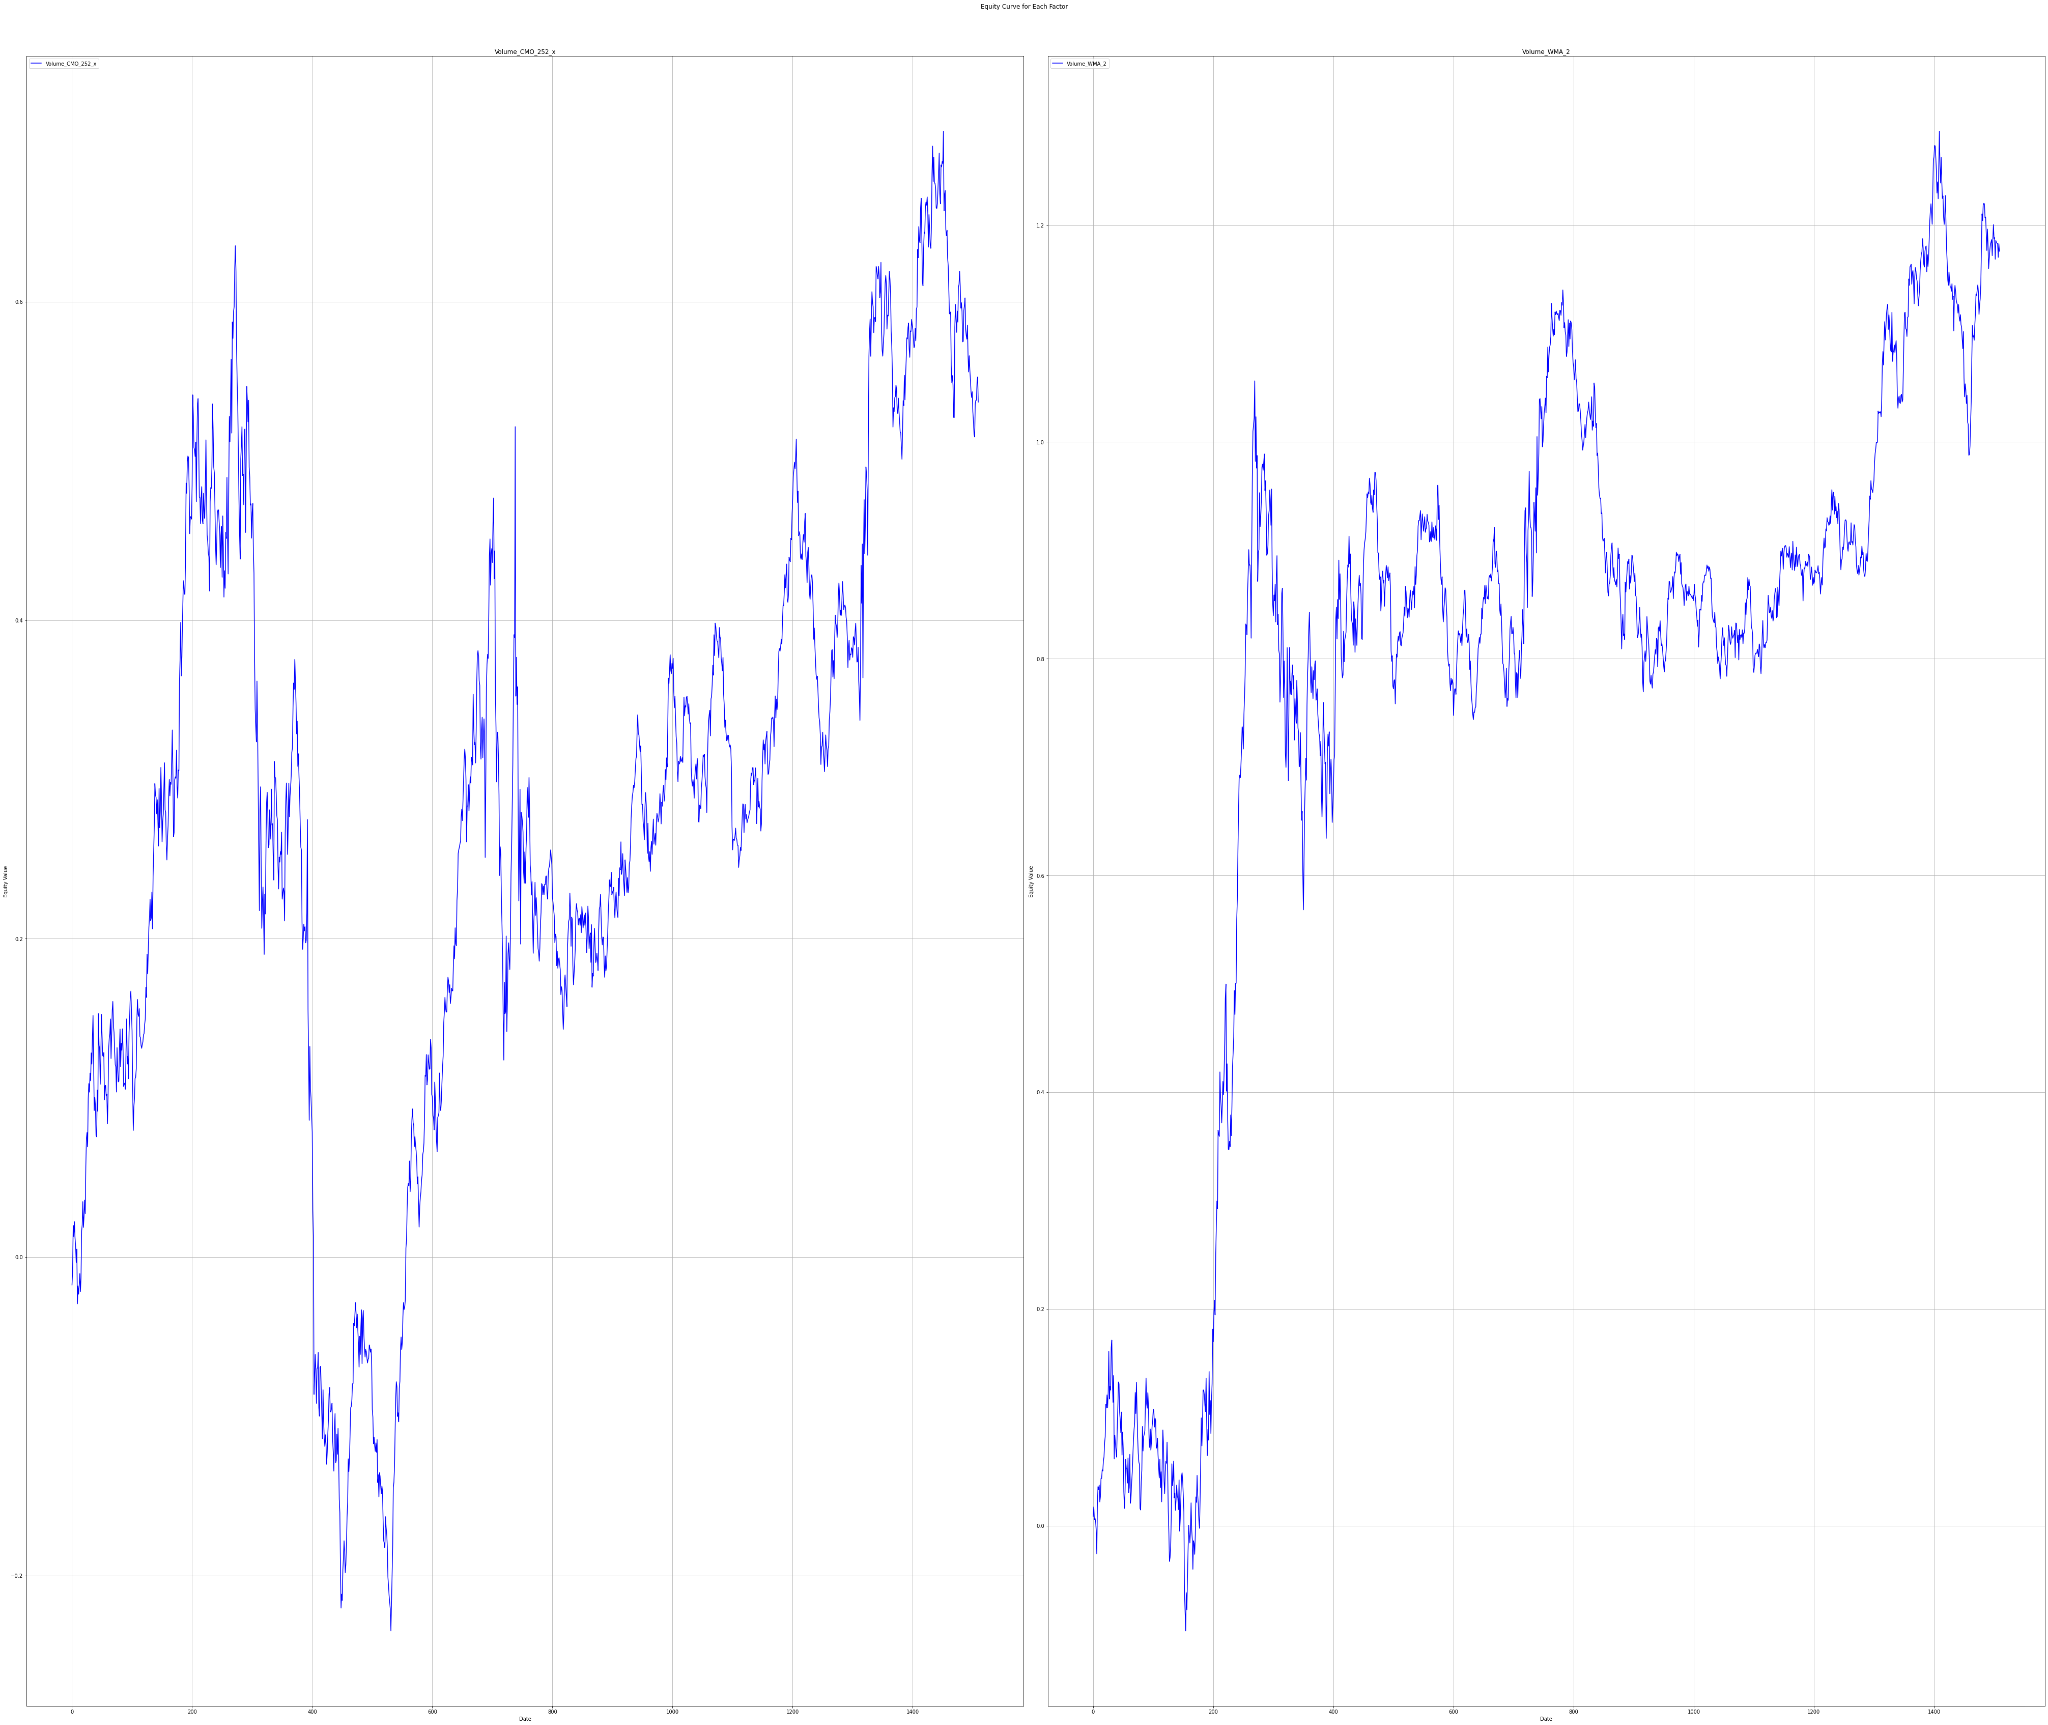
Let’s take a look at how traders who believed in the two most trending factors have fared in recent years
Statistics for factors
Factor Statistics 1990 – 2023
| Top mover factor within the factor group | T-Stat | P-Value | Direction |
|---|---|---|---|
| Volume_CMO_252_x | +0.7212 | +0.2354 | -1.0 |
| Volume_WMA_2 | +1.5140 | +0.0651 | +1.0 |
In the table, we can see the T-Stat and P-Value for the entire period of history for which we evaluate the factors, i.e. 1990 – 2023. The Direction value shows the direction in which the factor affects the movement of the share price, +1 expresses the positive impact of the increasing factor on the share price, and -1 expresses the negative impact of the increasing value of the factor on the share price. In simple terms of theory, we can say that a T-statistic that is greater than 2.0 or less than -2.0 is statistically significant; and if the P-value is less than 0.05, we reject the null hypothesis and say that we found a statistically significant effect.
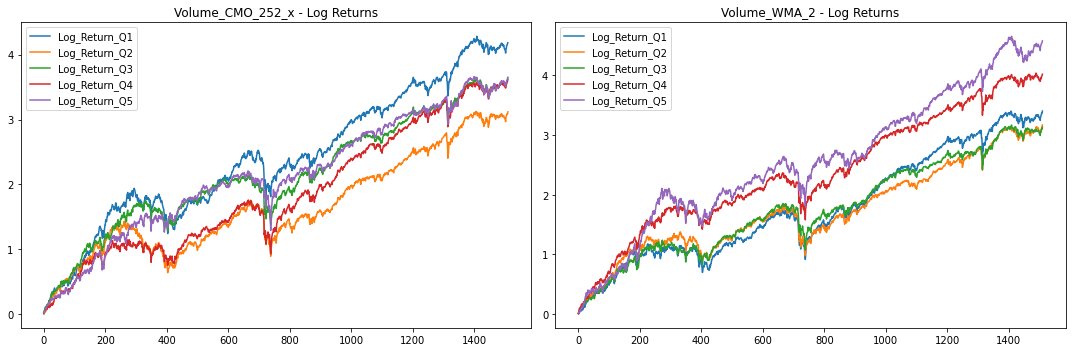
To understand the performance of these factors, we delve into their long-only portfolios based on quantiles, and long-short portfolio returns. The five quantiles (Q1-Q5) divide the data into equal parts according to the respective factor value, creating a picture of distribution across the portfolios. Investors usually target Q1 or Q5 portfolios of a factor, depending on whether the higher or lower value of the factor is expected to outperform.
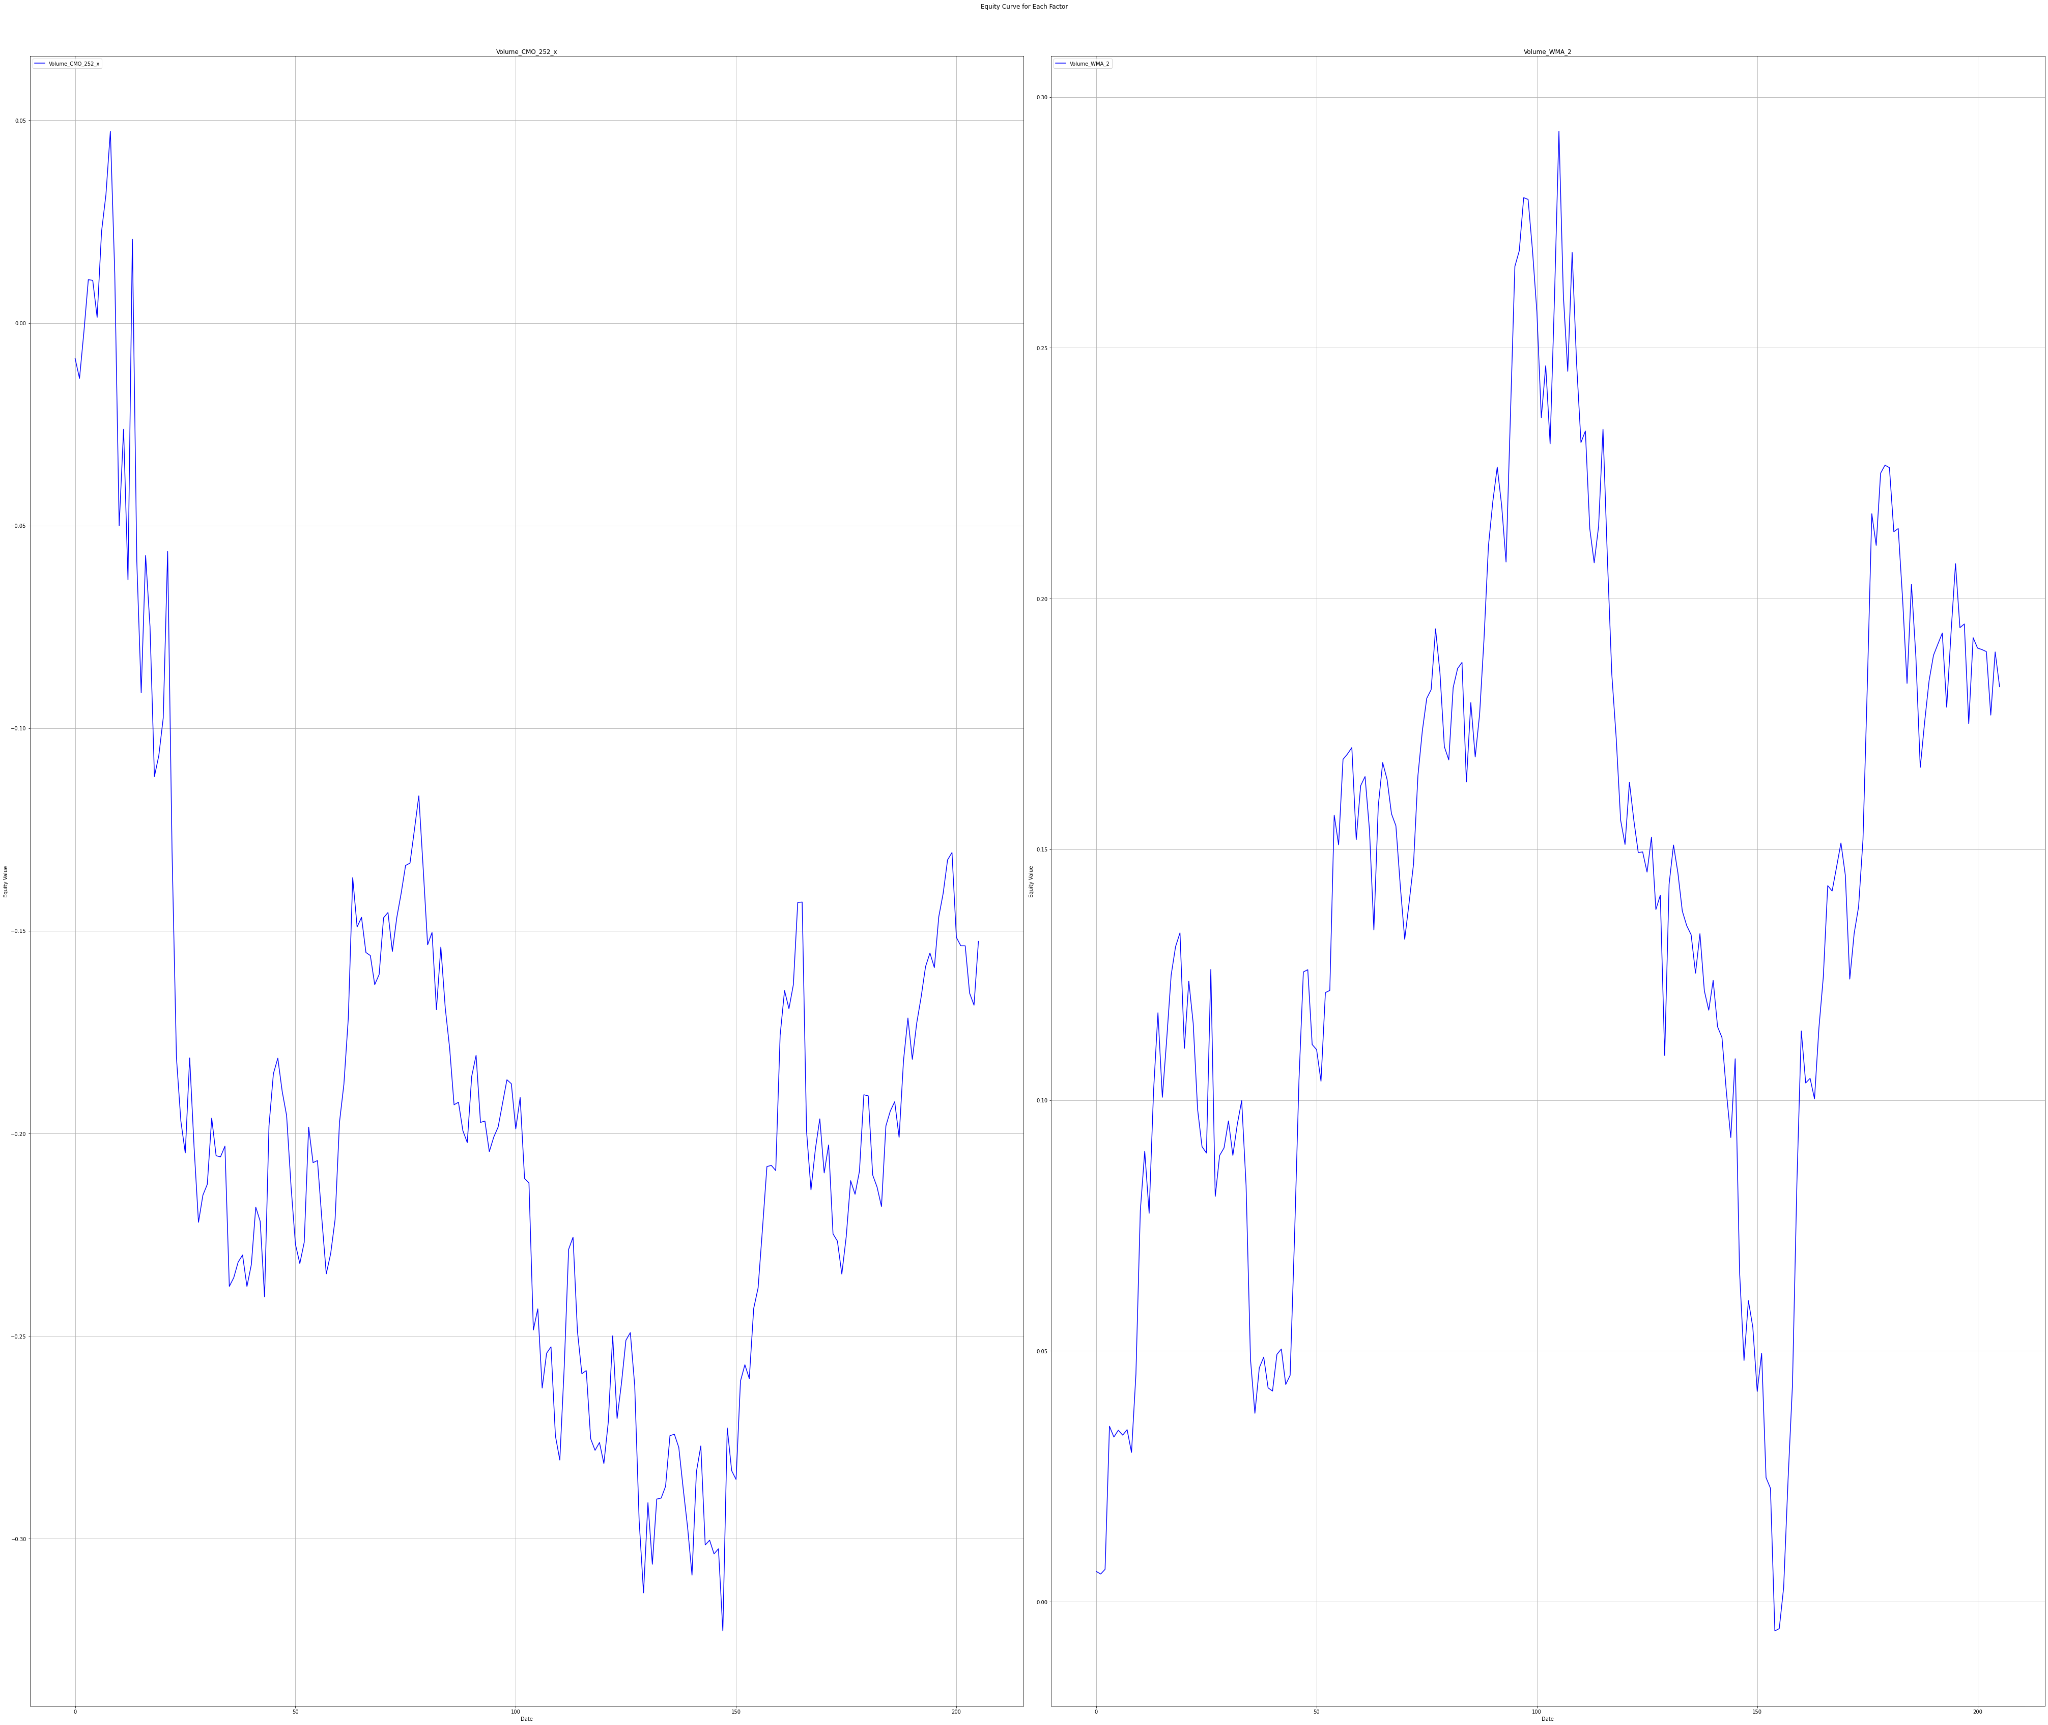
The charts below show Factor Statistics 1990 – 2023 for the 2 selected factors from the previous week.
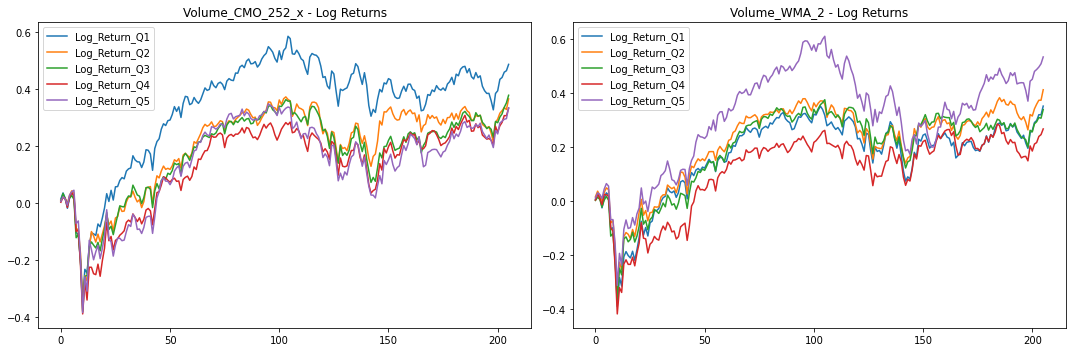
While the next one shows the behavior of the factors in the last 3 years.
Factor Statistics 2020 – 2023
| Top mover factor within the factor group | T-Stat | P-Value | Direction |
|---|---|---|---|
| Volume_CMO_252_x | -0.5611 | +0.7123 | -1.0 |
| Volume_WMA_2 | +0.8263 | +0.2047 | +1.0 |
The charts below show Factor Statistics 2020 – 2023 for the 2 selected factors from the previous week.
Factor Statistics Insights
For the first time in our adjusted TAOTS series, we can say that both the 1990-2023 period and the truncated 2020-2023 period factors have the same effect on stock price movements! Respectively, quantile Q1 for Volume CMP 252 x achieves the best returns on both periods, and quantile 5 achieves the best returns on Volume WMA 2. We thus find unique information useful for building “long-only” portfolios.
The long-short portfolio did not achieve the desired returns even over longer periods, as the reverse quantiles grew faster than the mean quantiles of Q2, Q3, or Q4.
Using factors in AI Stock Analysis
Our AI-powered StockPicking Lab is built on the factor investing approach combined with machine learning.
- In the first step, we focus on understanding the relationship between the high/low value of the factor under study for the stocks under consideration and the price movement of these stocks.
- Subsequently, we evaluate statistical significance using the P-value and T-statistic to select only the significant factors that we use to build the stock valuation model. There is no AI involved so far. However, this step already eliminates the basic problem of analysts evaluating stocks based on statistically insignificant factors and indicators.
These two points are the focus of our regular TAOTS. - In the next step, we can stack (ideally uncorrelated) factors into our model. This is where AI-based stock analysis comes in, as machine learning and its state-of-the-art methods should be used to select the best-performing uncorrelated factors and build robust stock strategies that work in most market situations. These investment strategies are what the StockPicking Lab provides. Read more in the article Stock Analysis with The Power of AI.