The AP on the Street 49th week of 2023 – Trending Factors

The AP on the Street 49th week of 2023 – Trending Factors
The latest edition of our factor-driven weekly newsletter is here, shedding light on the trending factors from the week of 04.12.2023 – 08.12.2023. We analyze the factors impacting stock prices, utilizing quantitative data to understand historical trends and new developments, and ultimately provide realistic investment insights.
Introduction
We delve into significant shifts in key stock market factors: quality, volatility, size, momentum, value, and trend. This week our analysis highlights changes in the Momentum and Quality factors.
Trending factors from last week
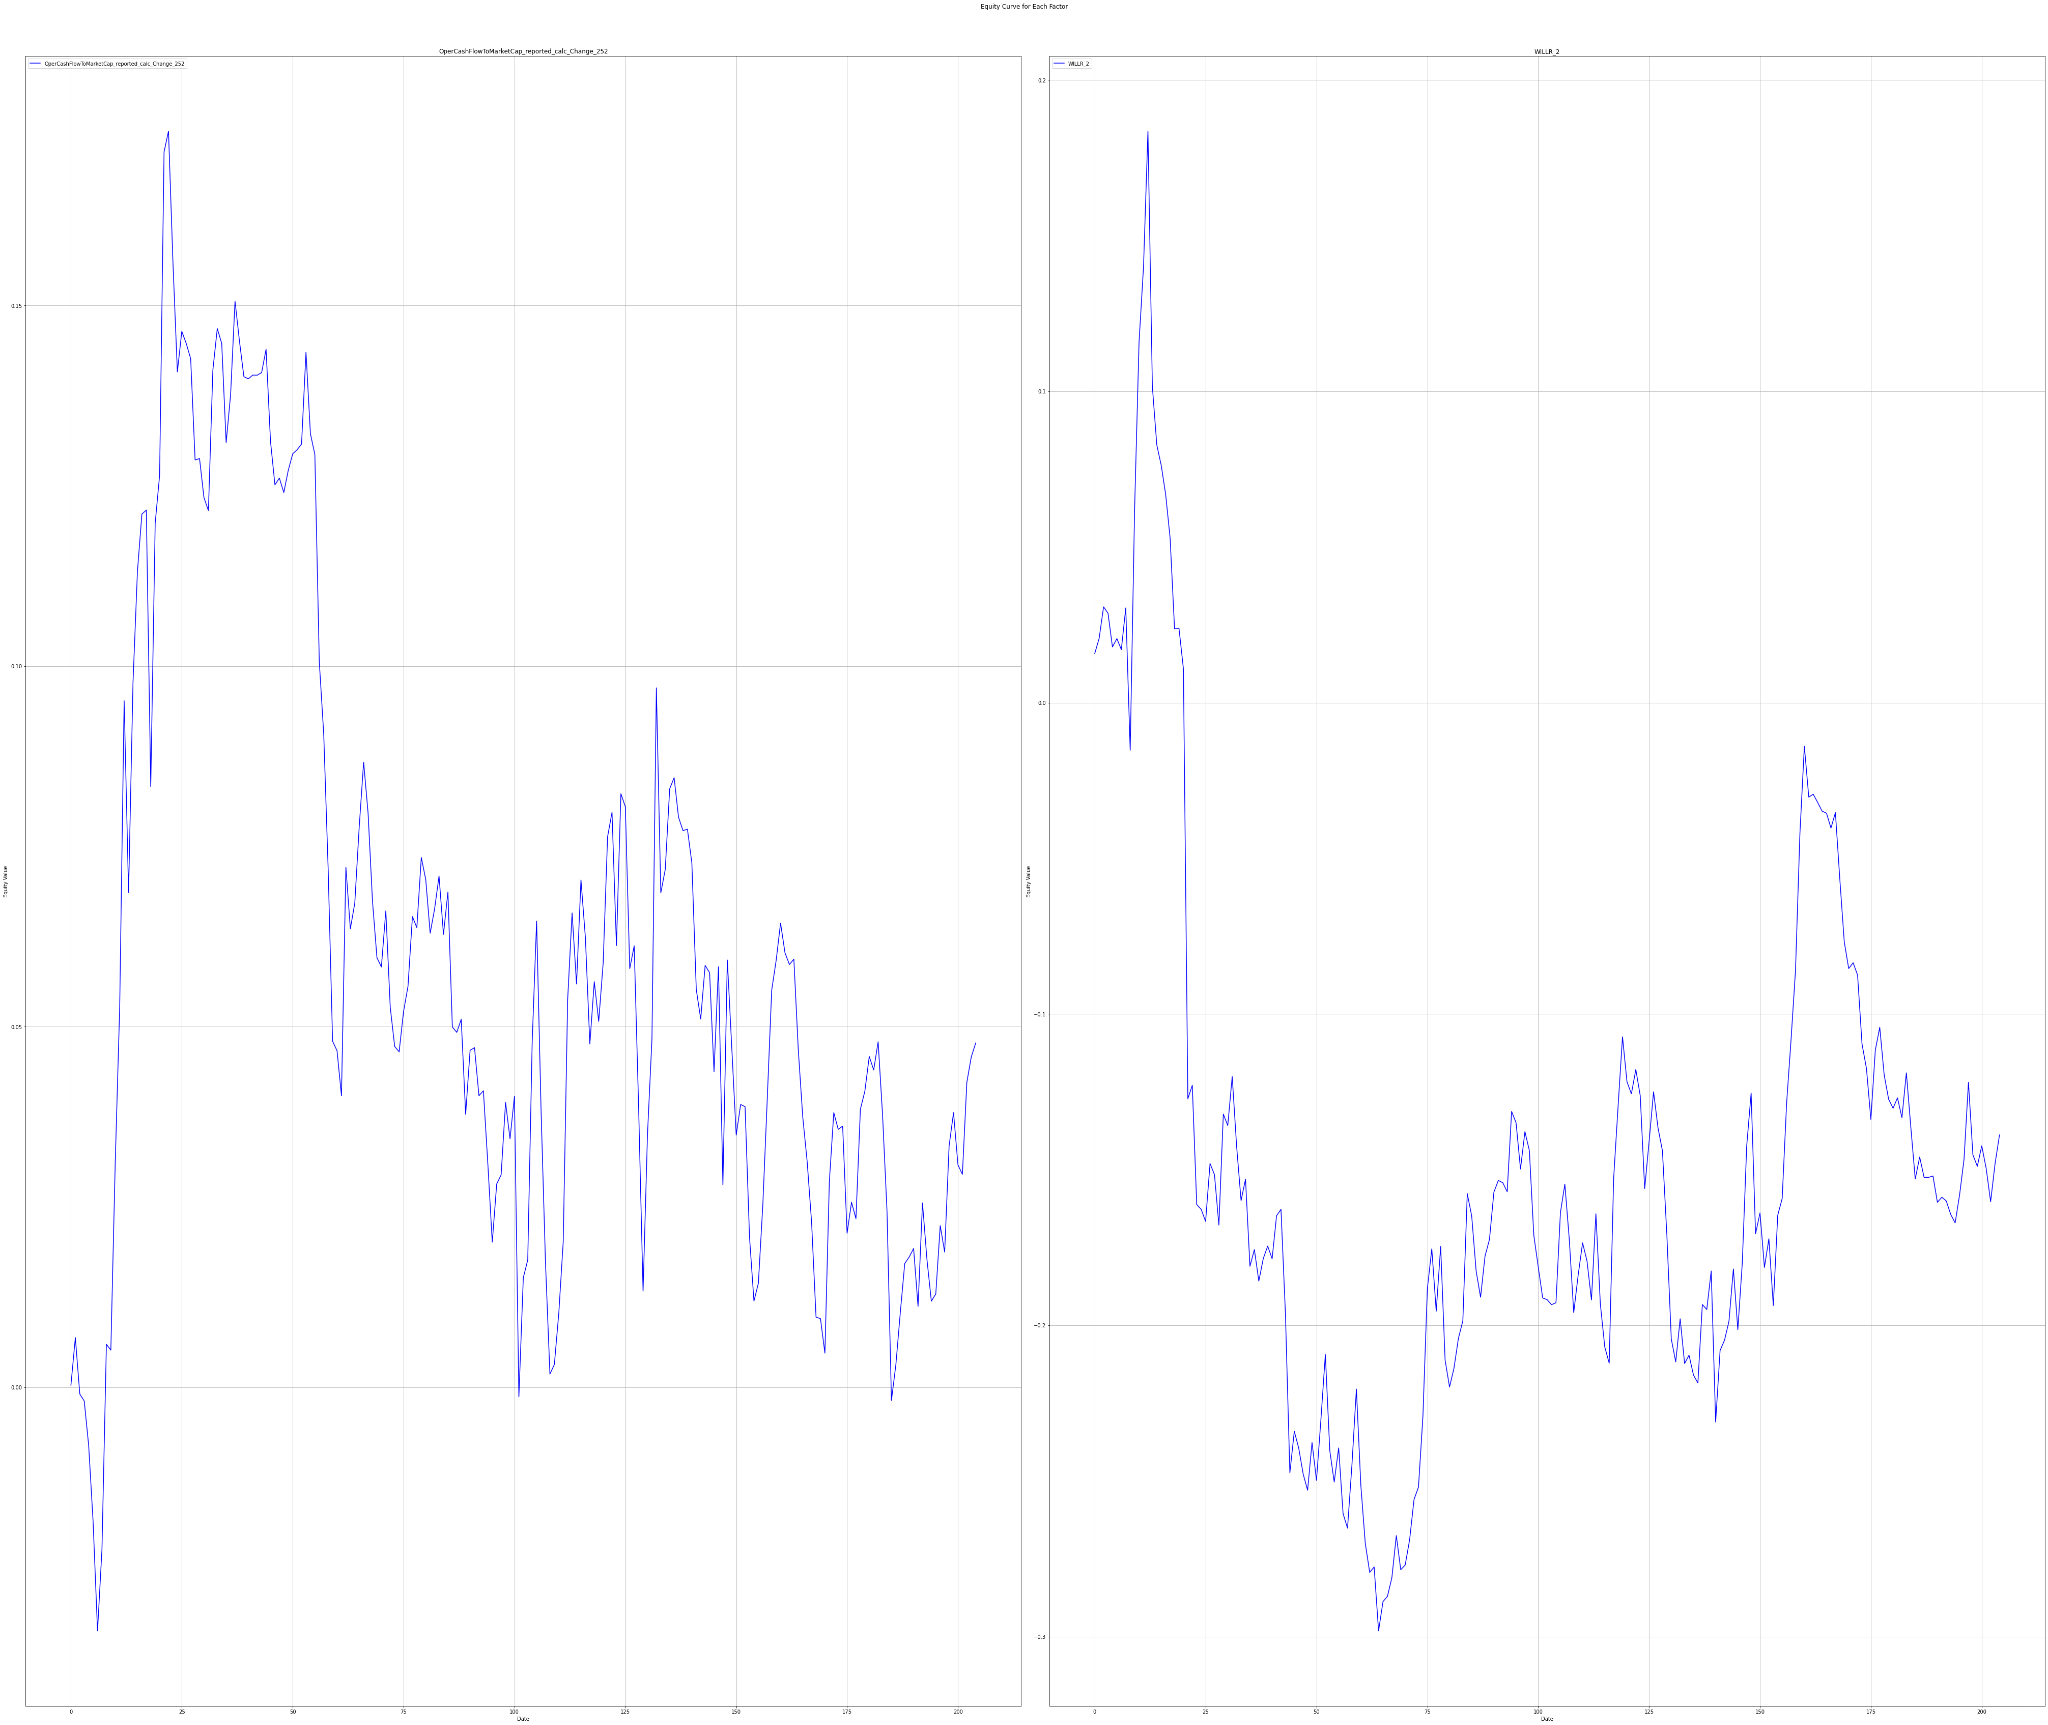
Based on the data for the 49th week of 2023, our attention is drawn to two top movers: the Williams %R indicator affiliated with the Momentum factor and OperCashFlowToMarketCap Change from the Quality factor group which have shown the highest movements within the groups.
The Williams %R indicator showed a steep rise (409.19%), indicating a strong upward momentum despite an overall decrease in the ’Momentum’ factor group by 24.72%. On the other hand, the Quality factor group had a minimal decrease in its value (-0.01%) led by just a 0.10% change in the OperCashFlowToMarketCap_reported_calc_Change_252 feature. However, the percentage changes in the Momentum factors are generally much higher than in the Quality factors due to the nature of the data.
Description of selected factors
WILLR 2 represents the Williams %R indicator, a type of momentum indicator that moves between 0 and -100 and measures overbought and oversold levels. A high number often indicates strong upward momentum in stock prices.
OperCashFlowToMarketCap_reported_calc_Change_252 is concerned with the Quality factor. This refers to the change in the ratio of operational cash flow to market capitalization of a firm over 252 trading days. It measures a company’s operational efficiency and its financial health — a higher ratio generally indicates a strong company quality because it shows a firm is generating more cash relative to its market capitalization.
Invest in the forces that move stock prices
Leverage the power of factor investing with revolutionary software
Factor Statistics 04.12.2023 – 08.12.2023
| Top mover factor within the factor group | Mover value | Factor group | Group total value |
|---|---|---|---|
| WILLR_2 | +4.0919 | momentum | -0.2471 |
| OperCashFlowToMarketCap_reported_calc_Change_252 | +0.0985 | quality | -0.0001 |
| CurrencyVolumeRelChange_5vs10 | -1.1437 | size | -0.1729 |
| Volume_WMA_2 | -0.2060 | trend | -0.0015 |
| PriceBookValueRatio_reported_Change_252 | -0.1109 | value | +0.00274 |
| Skewness_5 | -1.2124 | volatility | -0.0945 |
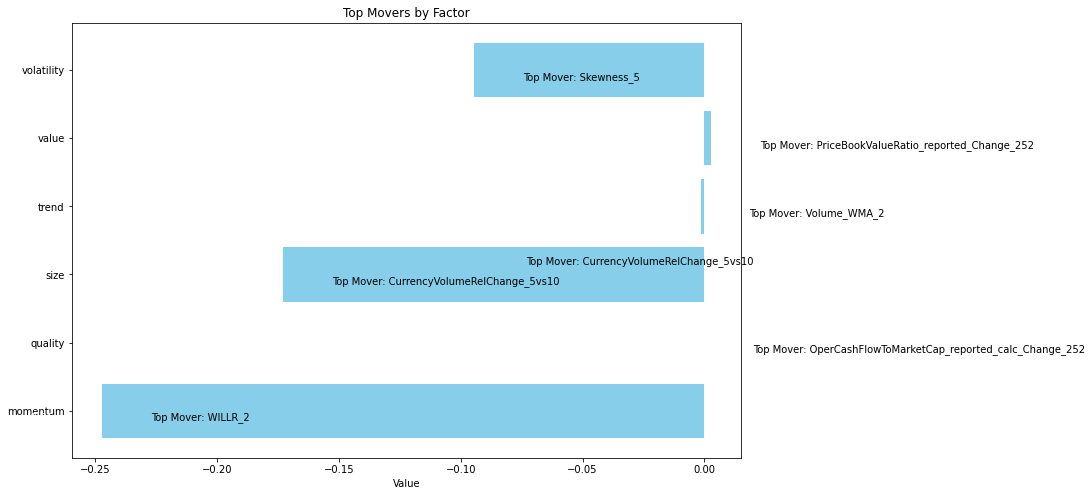
The figure shows the Top Movers across all the groups of factors we use in our analytics.
Let’s take a look at how traders who believed in the two most trending factors have fared in recent years
Statistics for factors
Factor Statistics 1990 – 2023
| Top mover factor within the factor group | T-Stat | P-Value | Direction |
|---|---|---|---|
| WILLR_2 | +7.0410 | +0.000009 | -1.0 |
| OperCashFlowToMarketCap_reported_calc_Change_252 | +2.0125 | +0.300042 | +1.0 |
In the table, we can see the T-Stat and P-Value for the entire period of history for which we evaluate the factors, i.e. 1990 – 2023. The Direction value shows the direction in which the factor affects the movement of the share price, +1 expresses the positive impact of the increasing factor on the share price, and -1 expresses the negative impact of the increasing value of the factor on the share price. In simple terms of theory, we can say that a T-statistic that is greater than 2.0 or less than -2.0 is statistically significant; and if the P-value is less than 0.05, we reject the null hypothesis and say that we found a statistically significant effect.
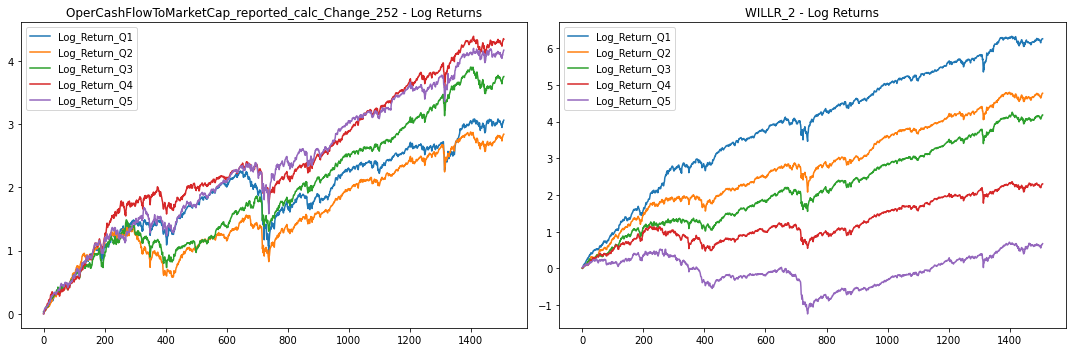
To understand the performance of these factors, we delve into their long-only portfolios based on quantiles, and long-short portfolio returns. The five quantiles (Q1-Q5) divide the data into equal parts according to the respective factor value, creating a picture of distribution across the portfolios. Investors usually target Q1 or Q5 portfolios of a factor, depending on whether the higher or lower value of the factor is expected to outperform.
The charts below show Factor Statistics 1990 – 2023 for the 2 selected factors from the previous week.
While the next one shows the behavior of the factors in the last 3 years.
Factor Statistics 2020 – 2023
| Top mover factor within the factor group | T-Stat | P-Value | Direction |
|---|---|---|---|
| WILLR_2 | -0.4365 | +0.668549 | -1.0 |
| OperCashFlowToMarketCap_reported_calc_Change_252 | +0.2383 | +0.405911 | +1.0 |
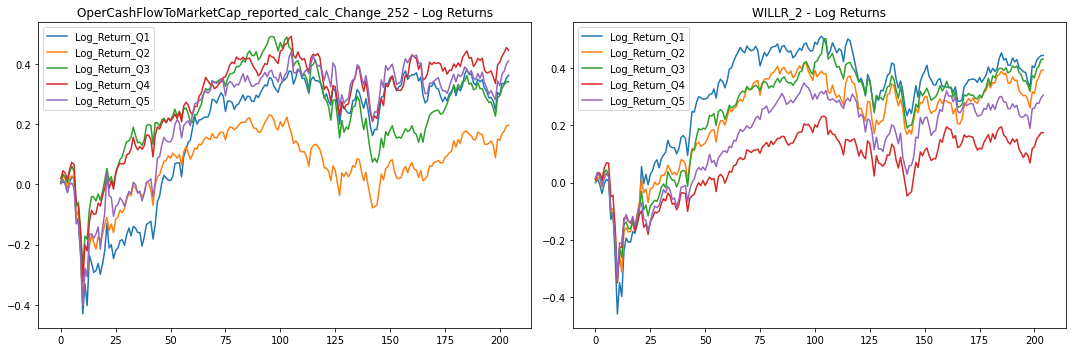
The charts below show Factor Statistics 2020 – 2023 for the 2 selected factors from the previous week.
Factor Statistics Insights
We have calculated returns for long-only portfolios mimicking the factor values, so we have created 5 portfolios consisting of stock affiliated to the specific portfolio/quantile by their factor values.
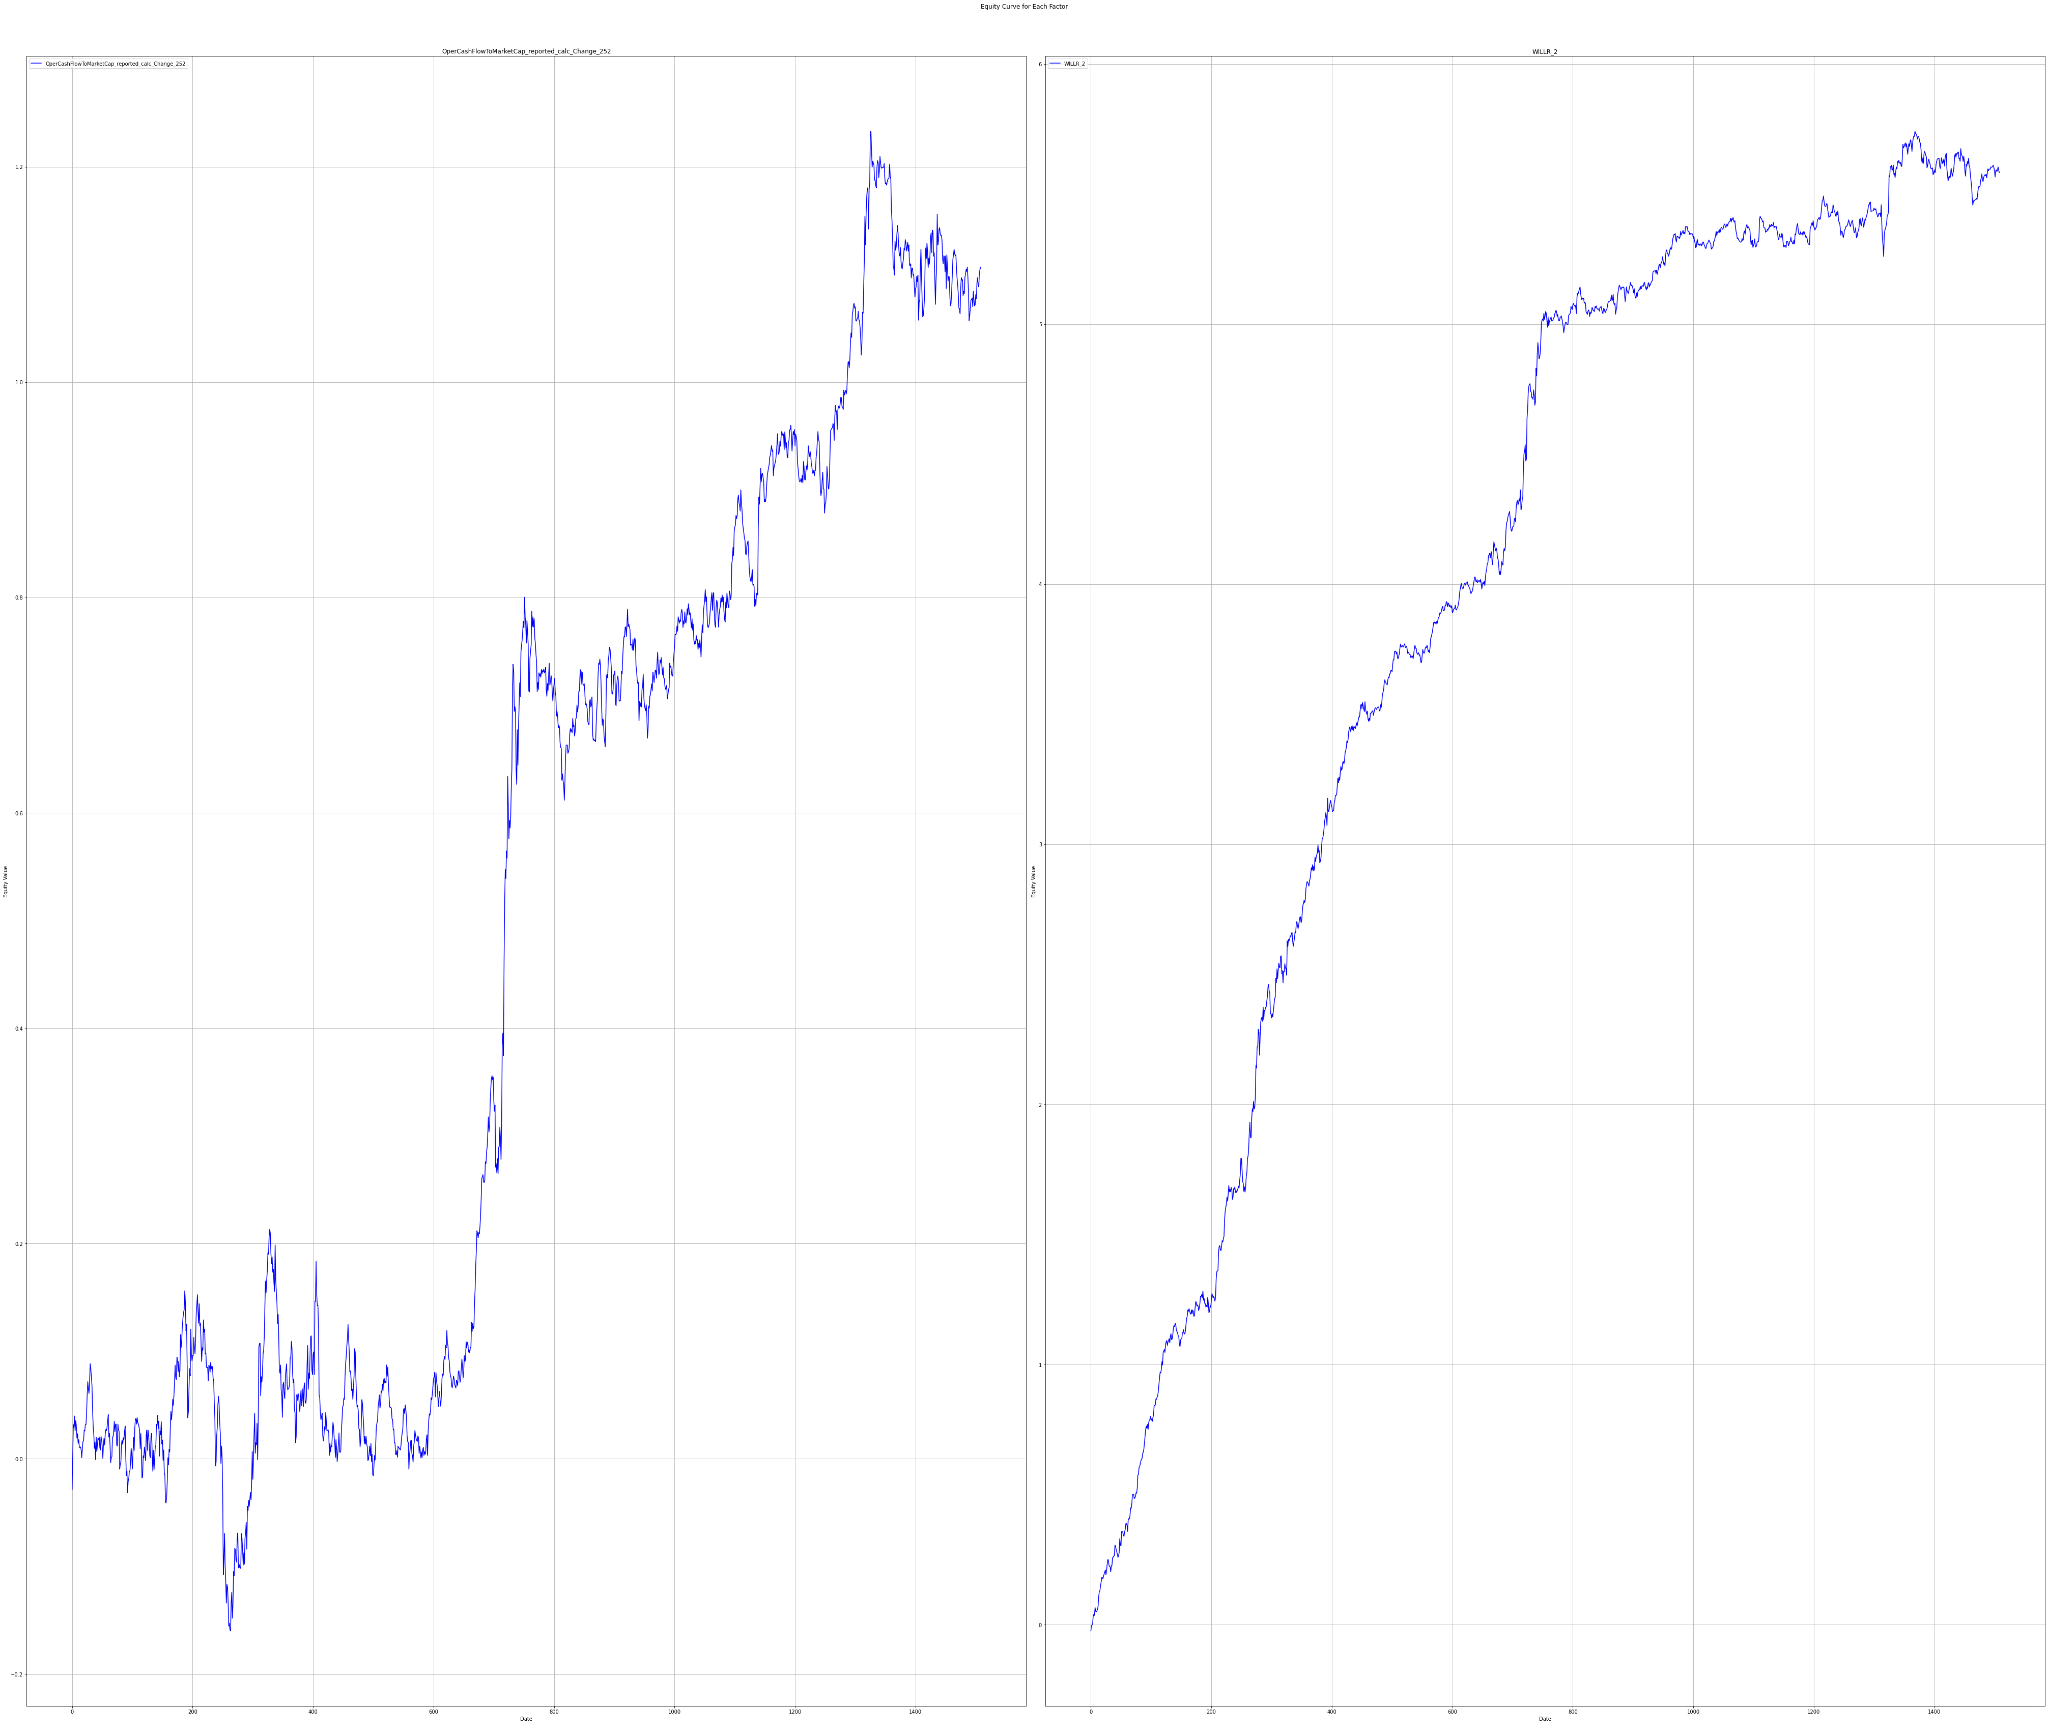
Additionally to the long-only factor mimicking portfolios, we have computed returns for a long-short portfolio designed as market neutral portfolio where the long leg consists of stocks in the fifth quantile while the short leg consists of the first quantile. If the factor is impactful, the difference between long-side and short-side returns should be significantly different from zero.
In the period 1990-2023, we observed significant variations across quantiles in the Quality factor OperCashFlowToMarketCap_reported_calc_Change_252. For the Momentum factor, the Q1 quantile of WILLR 2 demonstrated a notable positive shift in stock prices, whereby all the quantiles are beautifully distributed, and over the long term, they deliver an almost ideal distribution from a factor investing perspective.
In 2020-2023, the factors decay and show essentially random results. This is matched by the poorer T-Stat and P-Value values, which would not include the assessed factors among the statistically significant in the short-term assessment.
Using factors in AI Stock Analysis
Our AI-powered StockPicking Lab is built on the factor investing approach combined with machine learning.
- In the first step, we focus on understanding the relationship between the high/low value of the factor under study for the stocks under consideration and the price movement of these stocks.
- Subsequently, we evaluate statistical significance using the P-value and T-statistic to select only the significant factors that we use to build the stock valuation model. There is no AI involved so far. However, this step already eliminates the basic problem of analysts evaluating stocks based on statistically insignificant factors and indicators.
These two points are the focus of our regular TAOTS. - In the next step, we can stack (ideally uncorrelated) factors into our model. This is where AI-based stock analysis comes in, as machine learning and its state-of-the-art methods should be used to select the best-performing uncorrelated factors and build robust stock strategies that work in most market situations. These investment strategies are what the StockPicking Lab provides. Read more in the article Stock Analysis with The Power of AI.