The AP on the Street 47th week of 2023 – Trending Factors

The AP on the Street 47th week of 2023 – Trending Factors
The latest edition of our factor-driven weekly newsletter is here, shedding light on the trending factors from the week of 20.11.2023 – 24.11.2023. Read the e-mail version.
Trending factors from last week
As usual, we identify the most performing factors in various groups, such as Momentum, Quality, Size, Trend, and Volatility. In this edition, we’ll delve into the top movers: Volume_RSI_2 (Momentum group of factors) and CurrencyVolume_1 (Size group of factors).
Description of selected factors
Volume RSI 2:
(2 is the number of days where we analyze the factor)
- Purpose: Volume_RSI, or Volume Relative Strength Index, is a metric that applies the concept of the Relative Strength Index (RSI) to trading volume. RSI is commonly used to assess the momentum of price movements, and Volume_RSI extends this concept to measure the strength of trading volume.
- Calculation: Similar to RSI, Volume_RSI is calculated based on the ratio of average gains to average losses over a specified period. It is then normalized on a scale of 0 to 100.
- Interpretation: In general theory, a high Volume_RSI indicates strong buying interest and potential overbought conditions, while a low Volume_RSI suggests strong selling interest and potential oversold conditions. Traders often look for divergences between price movements and Volume_RSI to identify potential trend reversals.
- Application: Volume_RSI can be used to confirm trends observed in price movements, providing additional insights into the strength of market participants’ convictions.
Currency Volume 1:
- Purpose: CurrencyVolume is a metric that focuses on the volume of trading activity within a specific stock. It provides information about the liquidity and overall trading interest in a particular stock.
- Calculation: CurrencyVolume is a straightforward measure of the total trading volume within a specified time frame, typically expressed in terms of the base currency. It reflects the total amount of the base currency traded in the market.
- Interpretation: In general theory, a higher CurrencyVolume indicates increased liquidity and interest in particular asset (both buy or sell signals), potentially suggesting a more active and efficient trading environment. Conversely, lower CurrencyVolume may imply reduced interest and lower liquidity.
- Application: Currency volume is a valuable metric for evaluating the intensity of market sell-offs or buy-offs. Keeping track of this metric can assist investors in anticipating market movements.
Invest in the forces that move stock prices
Leverage the power of factor investing with revolutionary software
Factor Statistics 20.11.2023 – 24.11.2023
| Top mover factor within the factor group | Mover value | Factor group | Group total value |
|---|---|---|---|
| Volume_RSI_2 | +8.1983 | momentum | -0.1589 |
| CapExToMarketCap_reported_Change_66 | +0.0353 | quality | +0.0003 |
| CurrencyVolume_1 | +1.1776 | size | +0.0214 |
| Volume_EMA_2 | +0.3661 | trend | +0.0021 |
| PriceBookValueRatio_reported_calc_Change_126 | -0.1029 | value | -0.0107 |
| AR1_LogPrice_4_weeks | -0.9380 | volatility | -0.0535 |
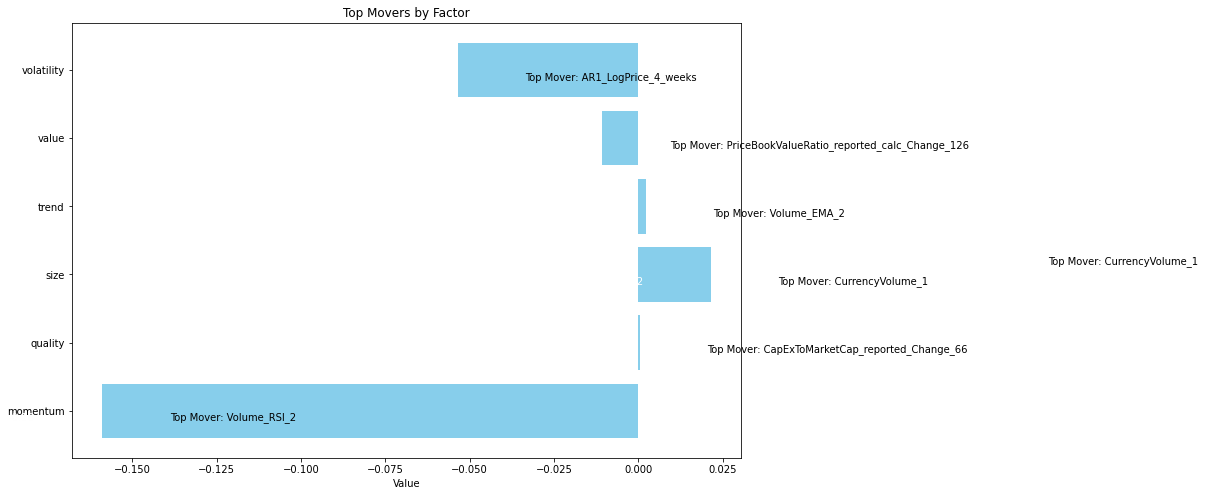
During the examination period, Volume_RSI factor weight moved up 820% while the whole category where it is in (momentum) declined by 16%.
In the meantime, the other factor under our examination, Currency Volume 1, increased by 118%, and the whole trend category increased by a very small 0.02%.
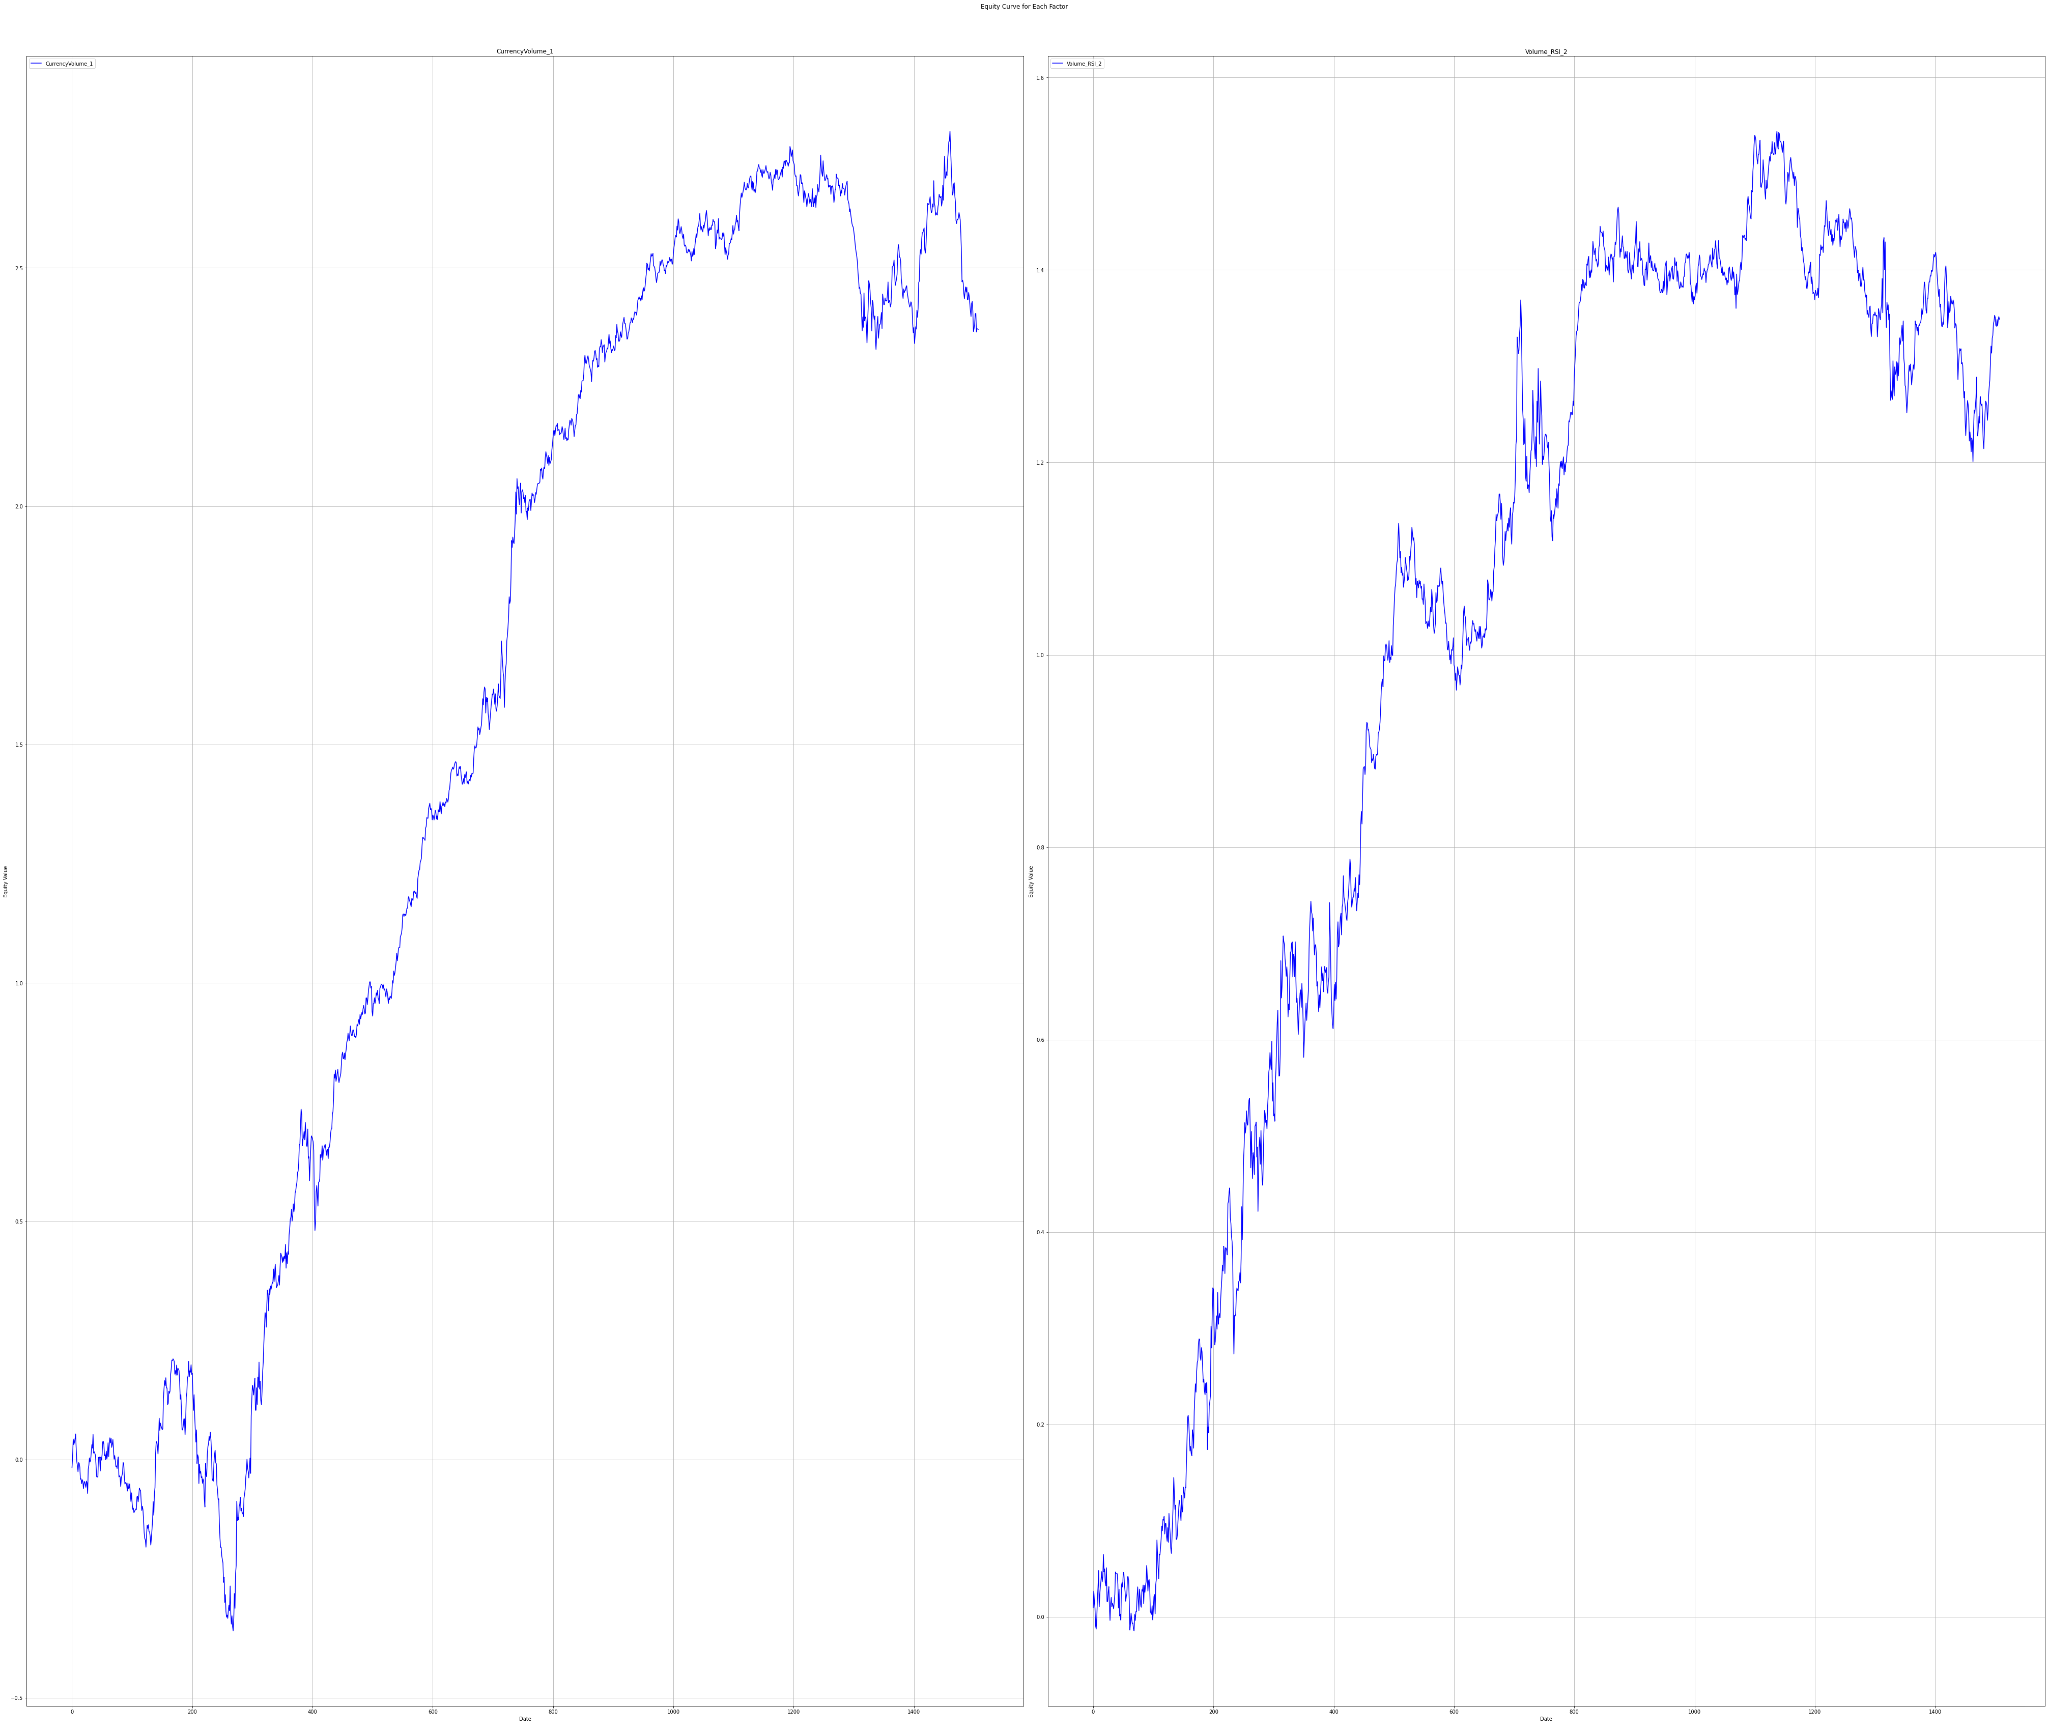
Let’s take a look at how traders who believed in the two most trending factors have fared in recent years
Statistics for factors
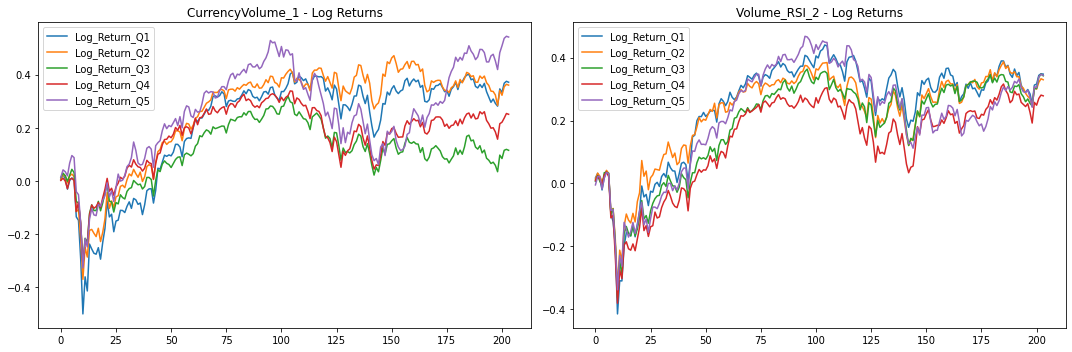
Factor Statistics 1990 – 2023
| Top mover factor within the factor group | T-Stat | P-Value | Direction |
|---|---|---|---|
| Volume_RSI_2 | +2.1755 | +0.01487 | +1.0 |
| CurrencyVolume_1 | +3.0550 | +0.0011 | -1.0 |
In the table, we can see the T-Stat and P-Value for the entire period of history for which we evaluate the factors, i.e. 1990 – 2023. The Direction value shows the direction in which the factor affects the movement of the share price, +1 expresses the positive impact of the increasing factor on the share price, and -1 expresses the negative impact of the increasing value of the factor on the share price.
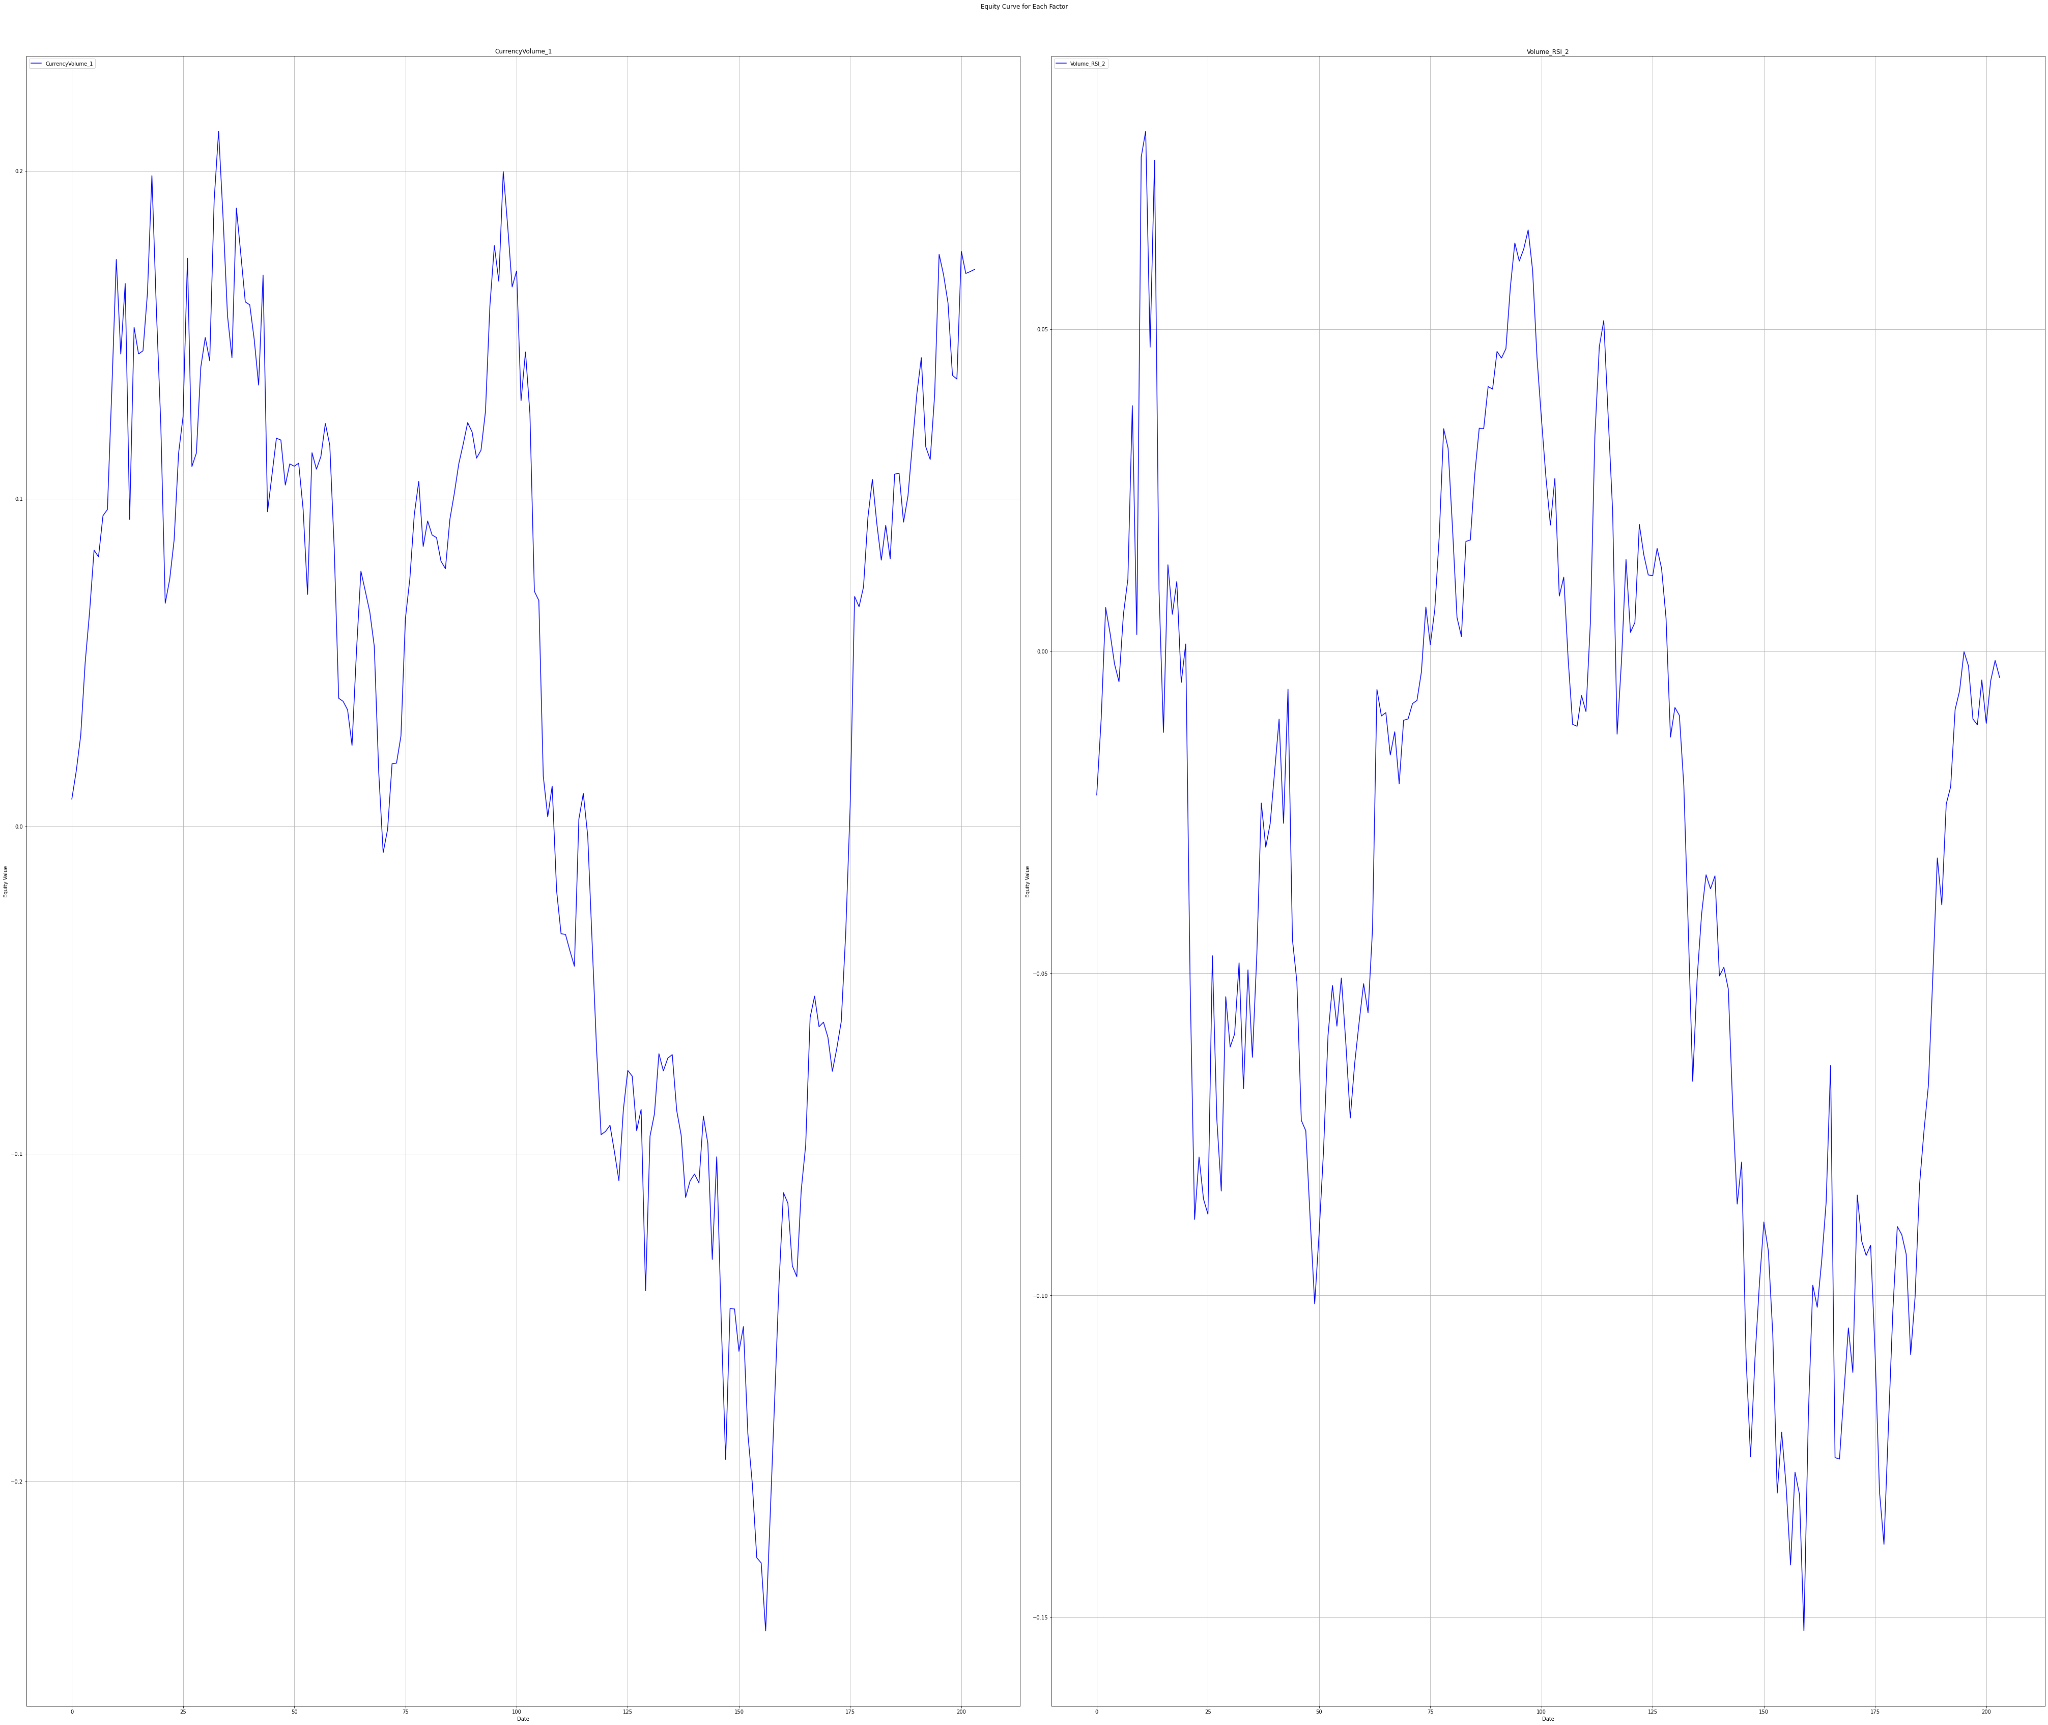
The charts below show Factor Statistics 1990 – 2023 for the 2 selected factors from the previous week.
While the next one shows the behavior of the factors in the last 3 years.
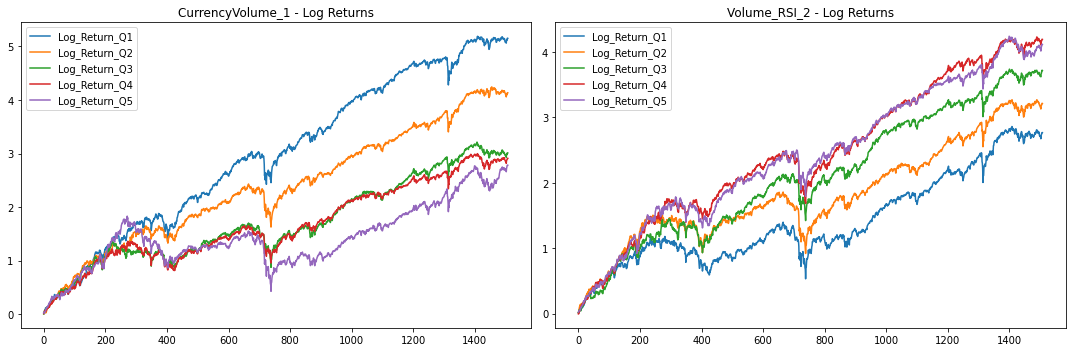
Factor Statistics 2020 – 2023
| Top mover factor within the factor group | T-Stat | P-Value | Direction |
|---|---|---|---|
| Volume_RSI_2 | -0.0171 | +0.5068 | -1.0 |
| CurrencyVolume_1 | +0.4967 | +0.3099 | +1.0 |
The charts below show Factor Statistics 2020 – 2023 for the 2 selected factors from the previous week.
Note that the effect on price movements for both factors has been exactly the opposite of the long-term history over the past three years.
Factor Statistics Insights
Let’s delve into the performance analysis of the two factors over the past three years initially. In the short term, examining both CurrencyVolume and Volume_RSI reveals a challenge in discerning a clear trend and performance distinction among quantiles. This ambiguity can be attributed to the super high p-values, diminishing the reliability of these features (Volume_RSI_2 P-Value: 0.51, CurrencyVolume_1 P-Value: 0.31).
However, a more optimistic picture emerges when considering the longer timeframe. Notably, distinct performance variations exist among quintiles for both factors. A clear division between quantiles becomes apparent.
Taking a closer look at CurrencyVolume, the factor exhibits a negative direction (as indicated in the table), signifying that a high value of CurrencyVolume leads to low performance in the long term. Q5 is notably lagging behind Q1. The factor is supported by a significantly low p-value of 0.1%, affirming that these results are not random.
Conversely, Volume_RSI demonstrates a positive direction. A substantial difference is observed between Q5, displaying robust growth, and Q1, reflecting the least growth. Additionally, Q4 also exhibits strong growth, at times overlapping with Q5. These results are reinforced by a low p-value of 1% in the long term.