The AP on the Street 46th week of 2023 – Trending Factors

The AP on the Street 46th week of 2023 – Trending Factors
The 6 factor-driven weekly newsletter is here. Let’s look at the trending factors from last week (13.11.2023 – 17.11.2023) as detected by our factor investing software. First, we identify the most performing Factors in every Group of Factors (Momentum, Quality, Size, Trend, Volatility). In the second step, we are focusing in more detail on two selected factors. Read the e-mail version.
Trending factors from last week
In this newsletter, we will focus on Price Earning Ratio Position 66 days which jumped the most within the Value Factor Group. Next, we look at Volume KAMA 10 days which moved the most in the trend group of factors.
Description of selected factors
Price to Earnings Ratio Relative Position 66 – Assessing Valuation Metrics:
Price to Earnings Ratio (P/E Ratio) Relative Position 66 is a metric employed to evaluate how expensive the stock is compared to its history.
The calculation involves determining the position of the P/E Ratio relative to the historical position over 66 days. A higher relative position suggests that the stock may be overvalued, while a lower position may indicate undervaluation.
Volume Kama 10 days – Assessing Smoothed Trading Volumes:
Volume Kama over 10 days is a metric utilized to analyze smoothed trading volumes within a 10-day period. The Kaufman Adaptive Moving Average (Kama) is applied to volume data, providing a smoothed representation of trading activity.
This analysis focuses on identifying trends and patterns in trading volumes while reducing the impact of short-term fluctuations. The Kama indicator adapts to changes in market conditions, offering a more nuanced perspective on trading dynamics.
A rising Volume Kama suggests sustained and increasing trading interest, while a declining trend may indicate a potential decrease in market activity. Traders and analysts can leverage this information to assess the overall health of the market and make more informed decisions based on smoothed volume data.
Invest in the forces that move stock prices
Leverage the power of factor investing with revolutionary software
Factor Statistics 13.11.2023 – 17.11.2023
| Top mover factor within the factor group | Mover value | Factor group | Group total value |
|---|---|---|---|
| PLUS_DI_2 | +2.7458 | Momentum | -0.2464 |
| OperCashFlowToMarketCap_reported_Position_66 | -0.1680 | Quality | -0.0046 |
| CurrencyVolumeRelChange_5vs10 | -1.7475 | Size | -0.2337 |
| Volume_KAMA_10_y | -0.0628 | Trend | +0.0006 |
| PriceEarningsRatio_reported_Position_66 | +0.5178 | Value | +0.0581 |
| T_statistic_5 | -1.4103 | Volatility | -0.1075 |
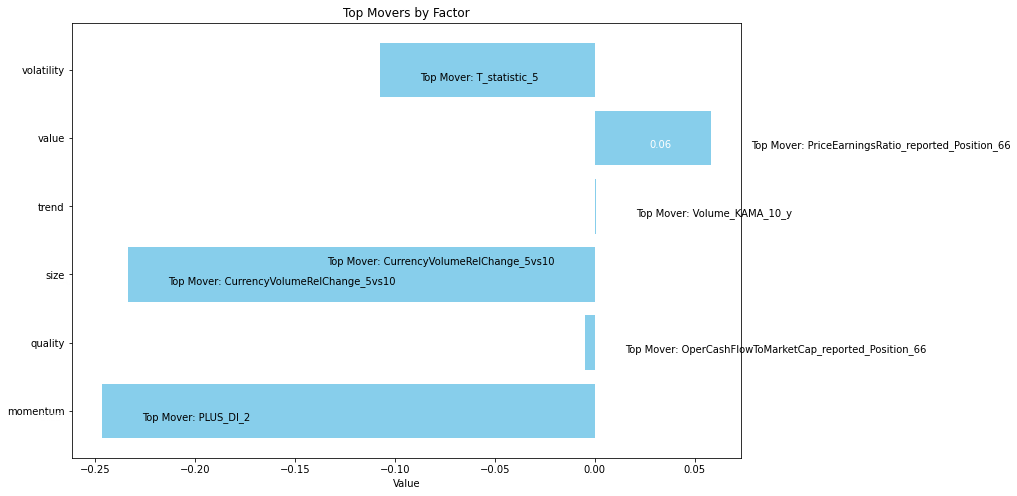
During the examination period, PriceEarning position 66 weight moved up 52% while the whole category where it is in (value) also increased by a smaller 6%.
In the meantime, the other factor under our examination, Volume KAMA 10, decreased by -6%, and the whole trend category increased by a very small 0.07%.
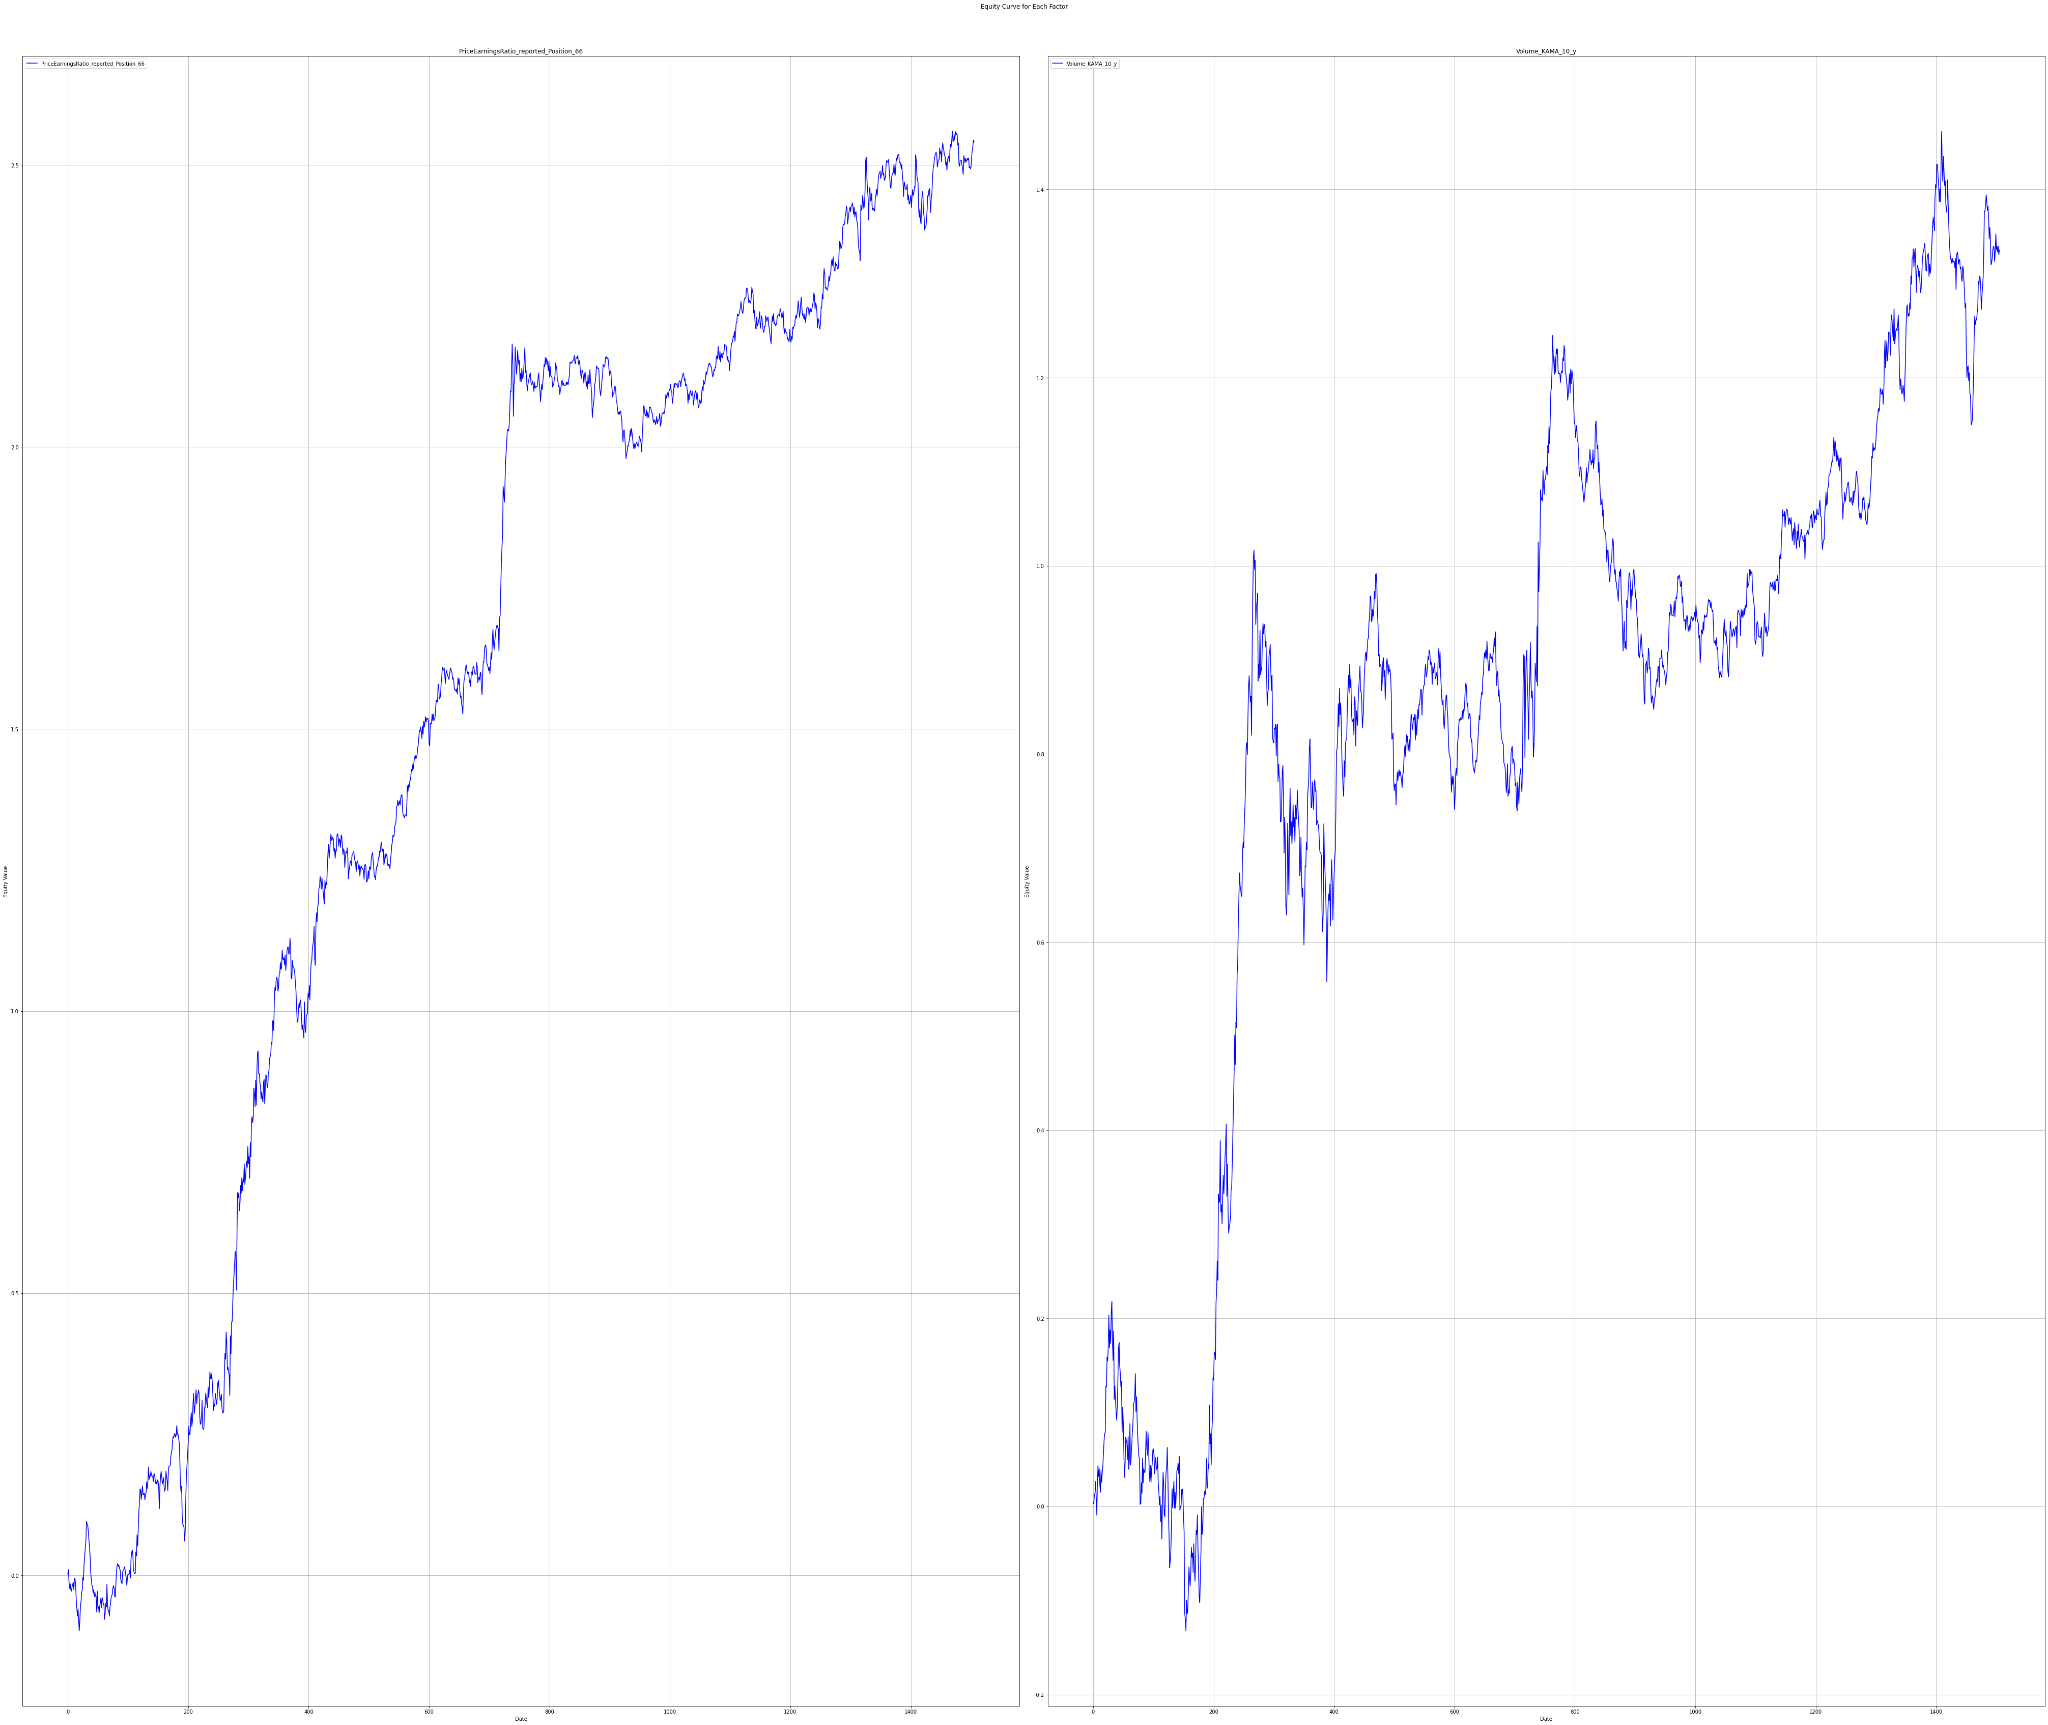
Let’s take a look at how traders who believed in the two most trending factors have fared in recent years
Statistics for factors
Factor Statistics 1990 – 2023
| Top mover factor within the factor group | T-Stat | P-Value | Direction |
|---|---|---|---|
| Volume_KAMA_10_y | 1.6829 | 0.0462 | +1.0 |
| PriceEarningsRatio_reported_Position_66 | 3.8137 | 0.0001 | -1.0 |
In the table, we can see the T-Stat and P-Value for the entire period of history for which we evaluate the factors, i.e. 1990 – 2023. The Direction value shows the direction in which the factor affects the movement of the share price, +1 expresses the positive impact of the increasing factor on the share price, and -1 expresses the negative impact of the increasing value of the factor on the share price.
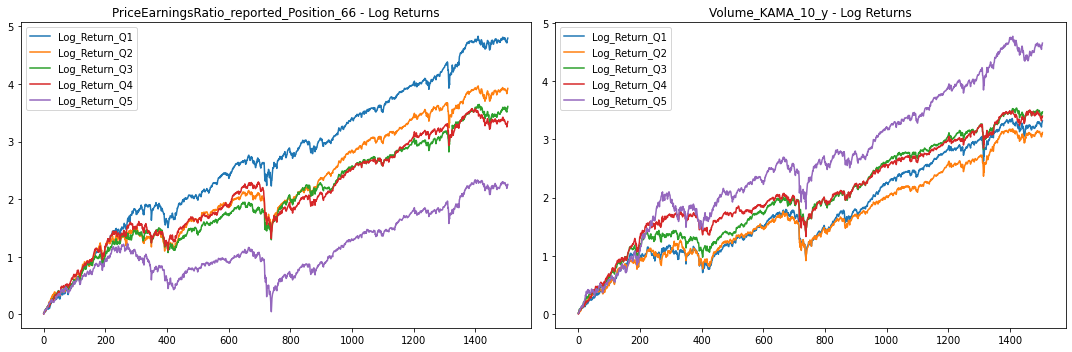
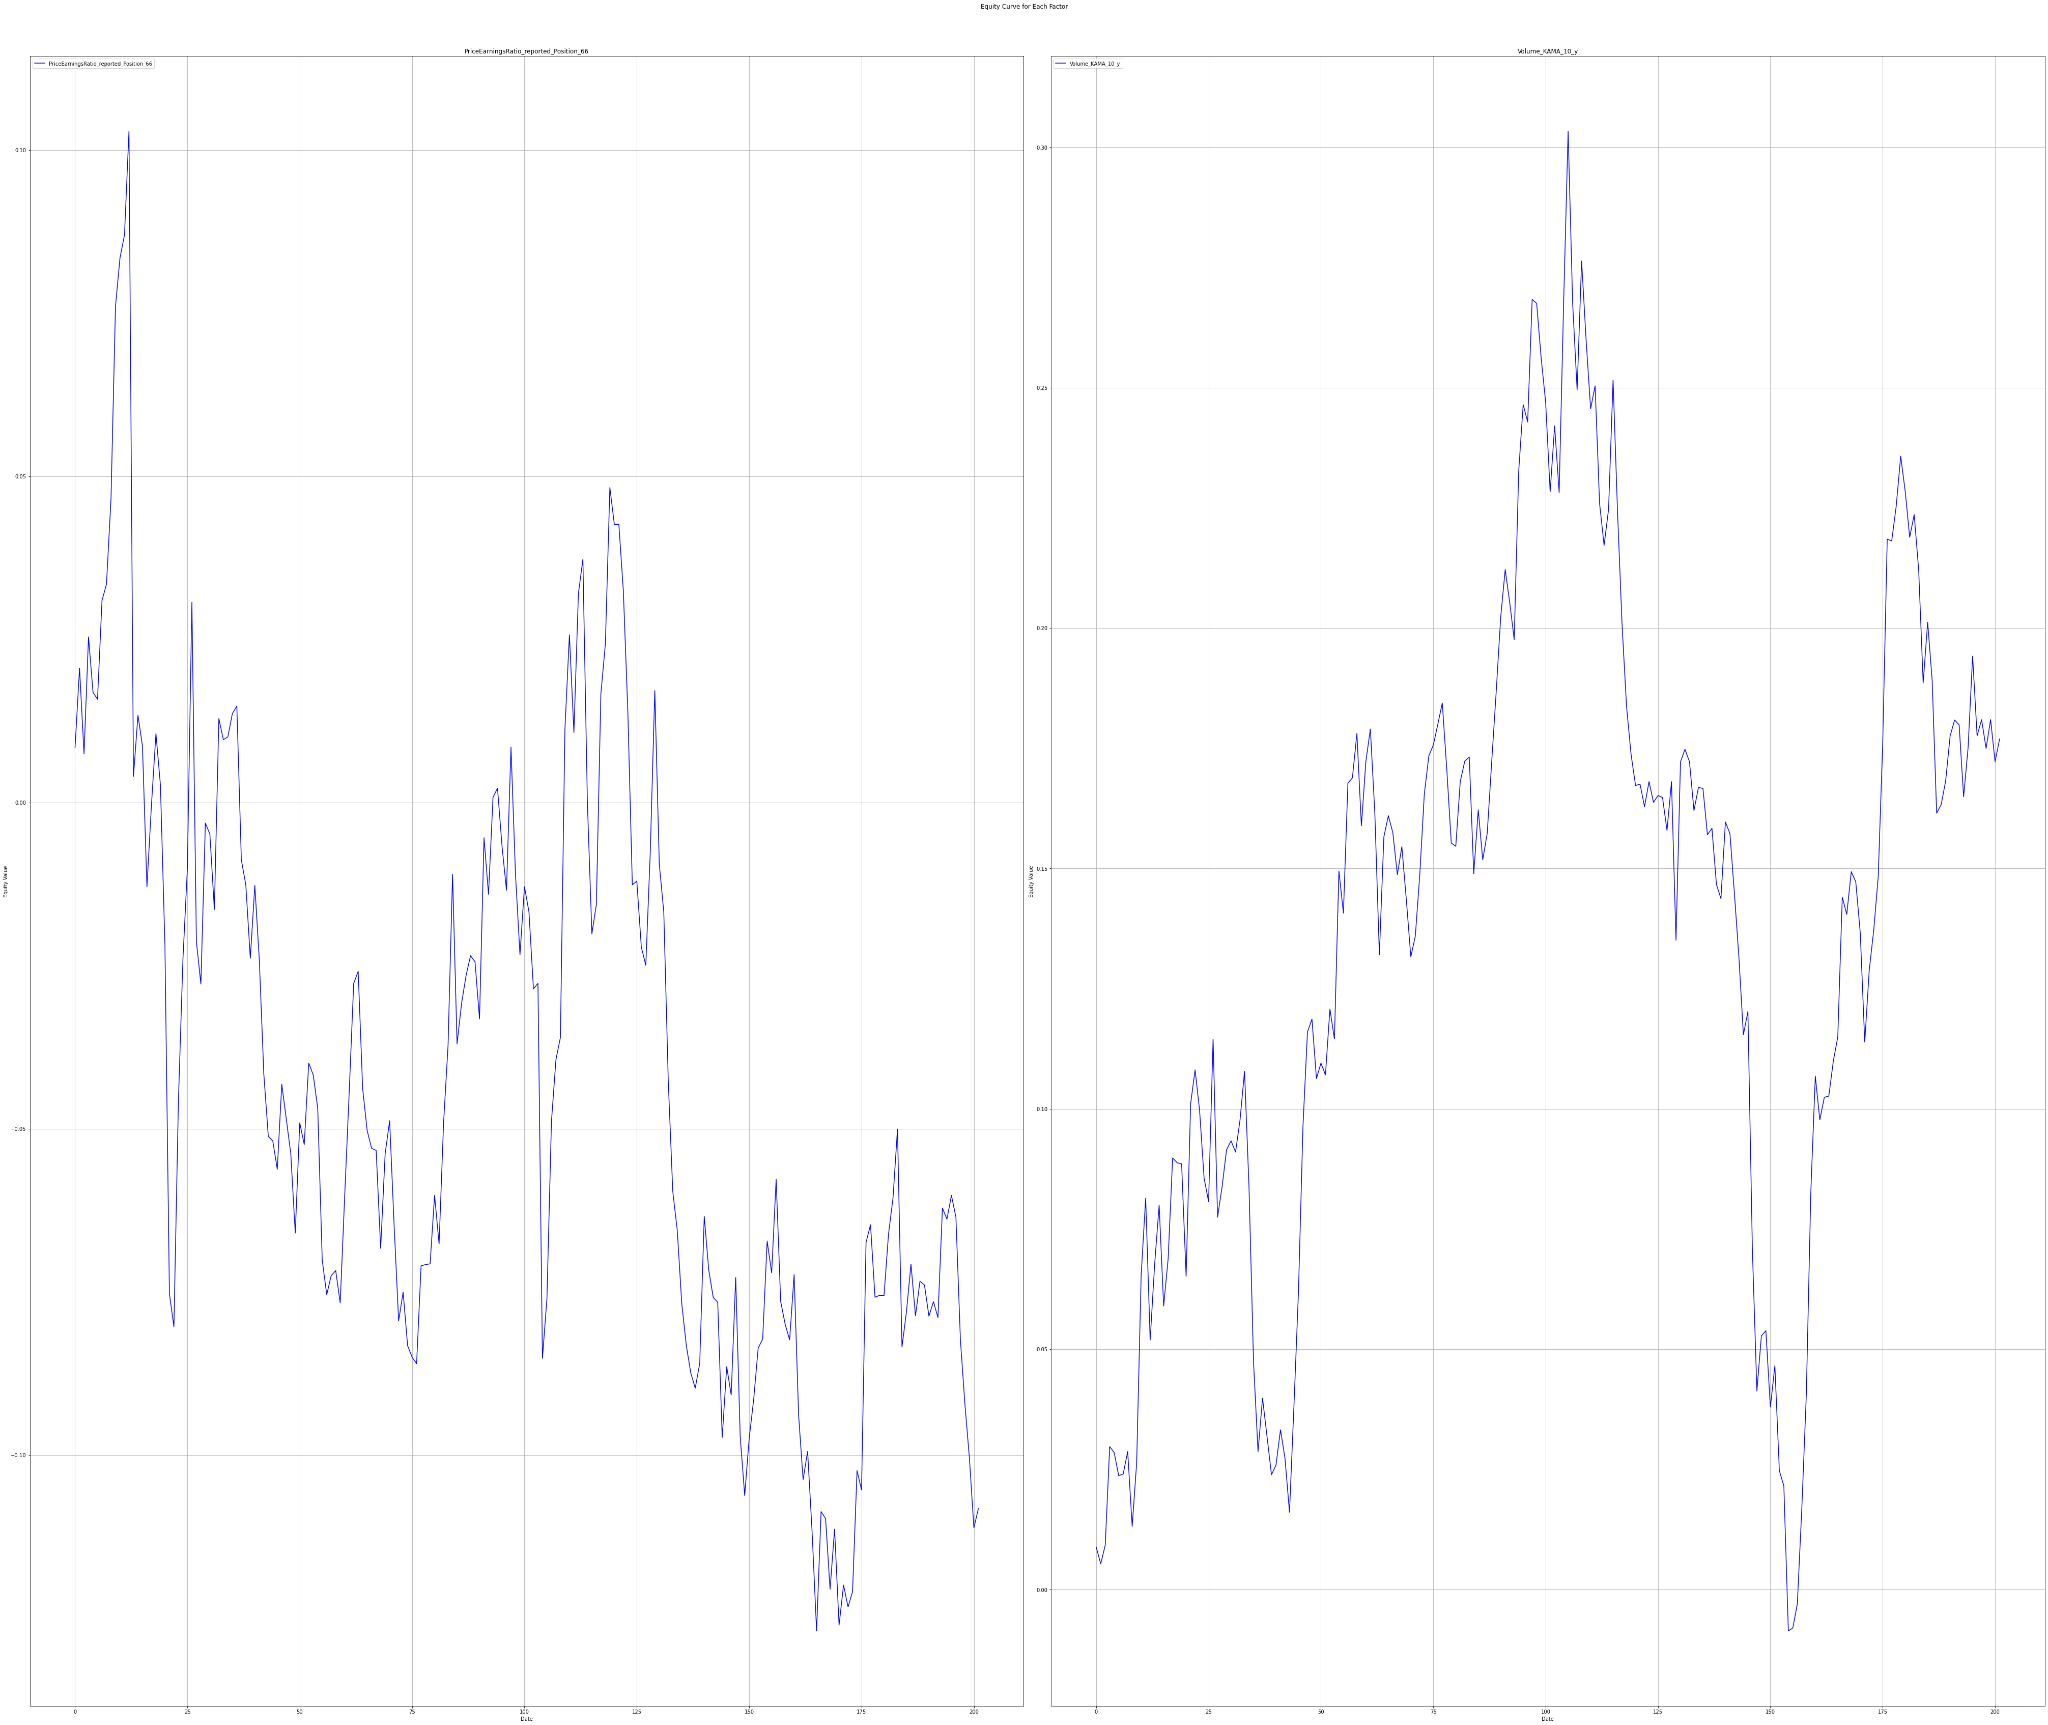
The charts below show Factor Statistics 1990 – 2023 for the 2 selected factors from the previous week.
While the next one shows the behavior of the factors in the last 3 years.
Factor Statistics 2020 – 2023
| Top mover factor within the factor group | T-Stat | P-Value | Direction |
|---|---|---|---|
| Volume_KAMA_10_y | 0.7470 | 0.2279 | +1.0 |
| PriceEarningsRatio_reported_Position_66 | -0.4452 | 0.6716 | -1.0 |
The charts below show Factor Statistics 2020 – 2023 for the 2 selected factors from the previous week.
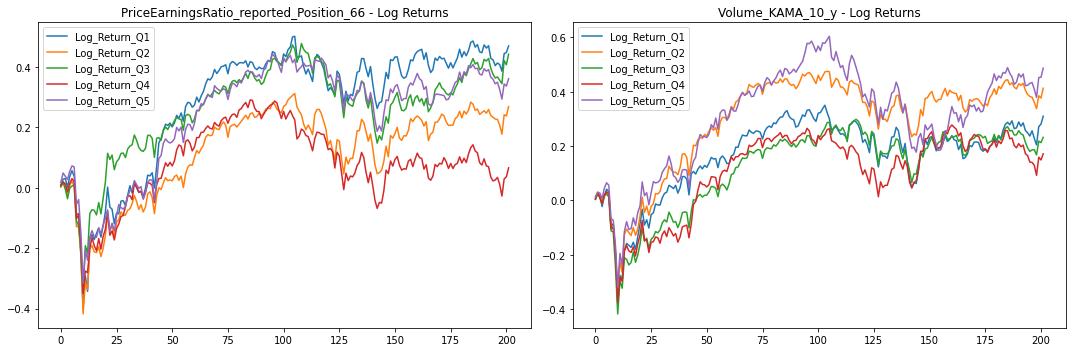
Factor Statistics Insights
Let’s check into the performance analysis of the two factors over the past three years first.
In the short term, examining both the Price-to-Earnings ratio position and KAMA reveals a challenge in discerning a clear trend and performance distinction among quantiles. This ambiguity can be attributed to the elevated p-values, rendering these features less reliable. However, a more encouraging picture emerges when considering the longer timeframe. Notably, distinct performance variations exist among quintiles for both factors.
Taking KAMA into account, it is clear that Q5, representing the quintile with the highest KAMA, outperformed all other quantiles. Importantly, the associated p-value falls within an acceptable range, reinforcing the credibility of this factor.
The situation is even better for the Price-to-Earnings ratio. An even better division is visible among quintiles, with higher P/E values correlating with poorer performance—consistent with the value factor outlined in the Fama and French model. The reliability of this metric is robust, supported by a very low p-value, indicating a high level of confidence in the results.