The AP on the Street 45th week of 2023 – Trending Factors

The AP on the Street 45th week of 2023 – Trending Factors
The fifth factor-driven weekly newsletter is here. Let’s look at the trending factors from last week (06.11.2023 – 10.11.2023) as detected by our factor investing software. First, we identify the most performing Factors in every Group of Factors (Momentum, Quality, Size, Trend, Volatility). In the second step, we are focusing in more detail on two selected factors. Read the e-mail version.
Trending factors from last week
In this newsletter, we will focus on Currency Volume Absolute Change over 5 and 10 days which jumped the most within the Size Factor Group. Next, we look at AR1 Log Price 4 Weeks which moved the most in the Volatility group of factors.
Description of selected factors
Currency Volume Absolute Change 5 and 10 Days – Assessing Trading Volumes:
Currency Volume Absolute Change over 5 and 10 days is a metric used to evaluate the absolute difference in trading volumes for a particular currency within the specified time frames.
This analysis helps traders and analysts gauge the change in trading activity, which is crucial in understanding market liquidity and potential price movements.
The calculation involves comparing the absolute difference between trading volumes on a daily basis over a 5-day and 10-day period, respectively, for the specific currency.
According to theory, higher absolute change values in trading volume over these periods might indicate increased market activity or interest, which can lead to higher returns. Our factor analysis shows how this works in practice and in different time frames.
AR1 Log Price 4 Weeks – Analyzing Autoregressive Models:
AR1 Log Price over 4 weeks involves utilizing autoregressive models to analyze the logarithmic price data of a currency across a 4-week period.
The AR1 model specifically examines the relationship between current and previous values within a time series, focusing on the logarithmic price of the currency over this defined period.
This analysis provides valuable insights into the persistence of price changes within the currency market, particularly in relation to volatility. According to theory, high volatility can potentially hinder future returns, making this analysis crucial for risk assessment and strategic decision-making.
Invest in the forces that move stock prices
Leverage the power of factor investing with revolutionary software
Factor Statistics 06.11.2023 – 10.11.2023
| Top mover factor within the factor group | Mover value | Factor group | Group total value |
|---|---|---|---|
| MINUS_DI_2 | +10.4497 | Momentum | -0.2617 |
| OperCashFlowToMarketCap_reported_Change_66 | -0.1417 | Quality | -0.0009 |
| CurrencyVolumeAbsChange_5vs10 | -1.3058 | Size | -0.2281 |
| Volume_KAMA_3 | -0.1446 | Trend | -0.0134 |
| PriceToFreeCashFlow_reported_Change_66 | -0.2618 | Value | -0.0240 |
| AR1_LogPrice_4_weeks | -1.3658 | Volatility | -0.1350 |
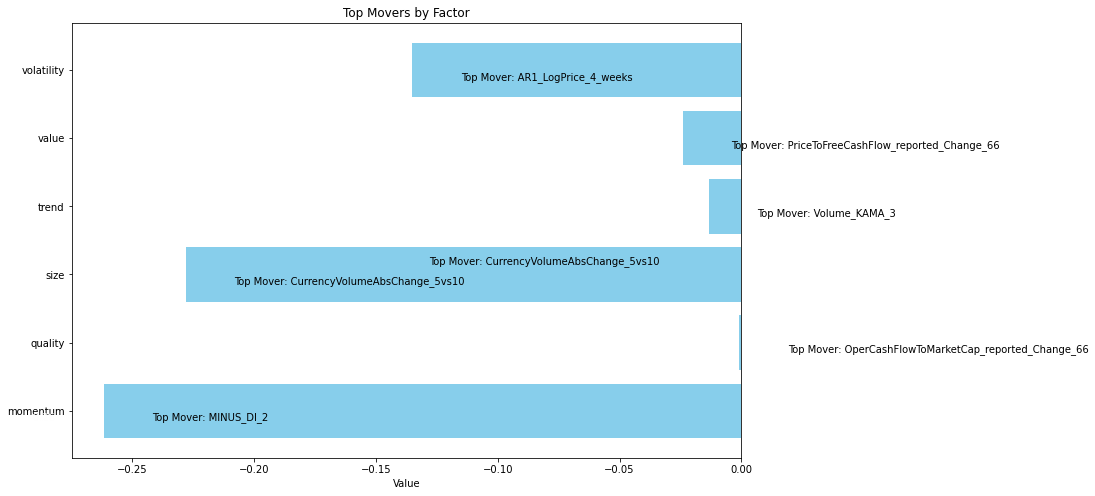
The Currency Volume Absolute Change 5vs10 is a financial indicator designed to assess the change in the volume of money flowing in and out of a given security for the specified stock. It compares the volume over the past 5 days with that of the past 10 days. During this period, its exposure decreased by 130%, and the overall exposure of the entire factor group, specifically size, reduced by 22%. Simultaneously, another selected factor, AR1 Log Price 4 Weeks, faced a comparable situation. The exposure to this factor decreased by 136%, and the exposure of the entire factor, namely volatility, decreased by 13%. AR1_logPrice_4_weeks utilizes an Autoregressive model to assess the relationship between future and current prices.
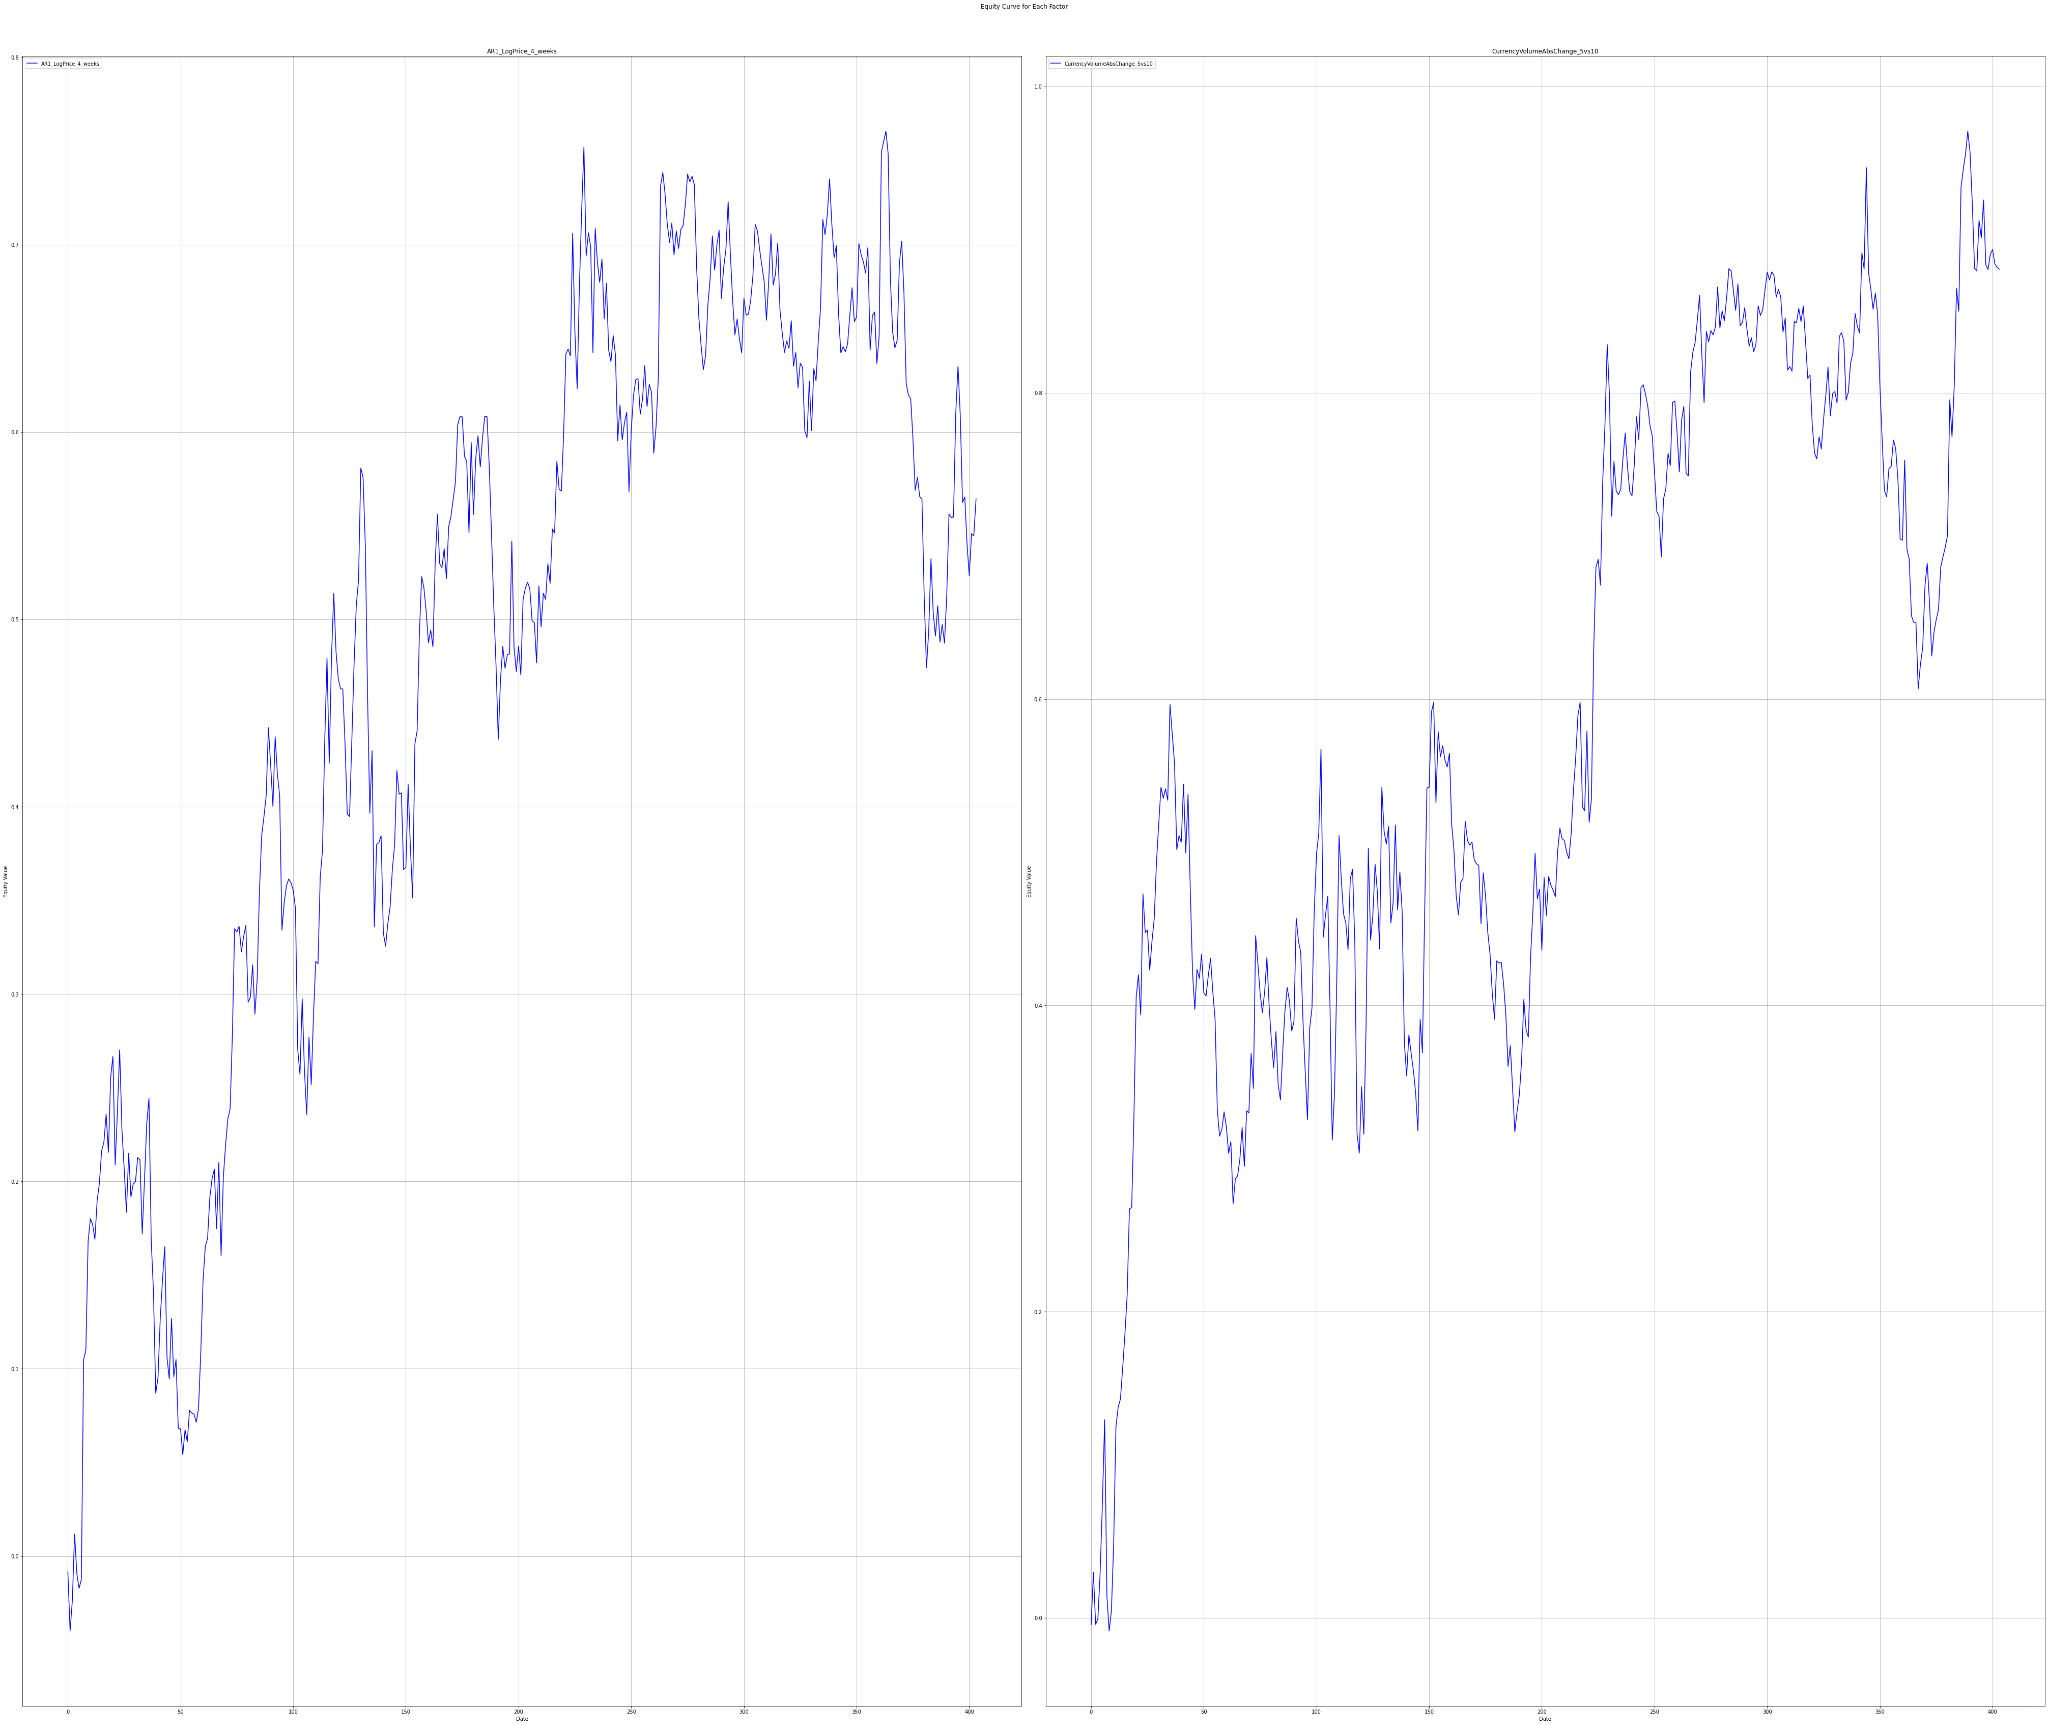
Let’s take a look at how traders who believed in the two most trending factors have fared in recent years
Statistics for factors
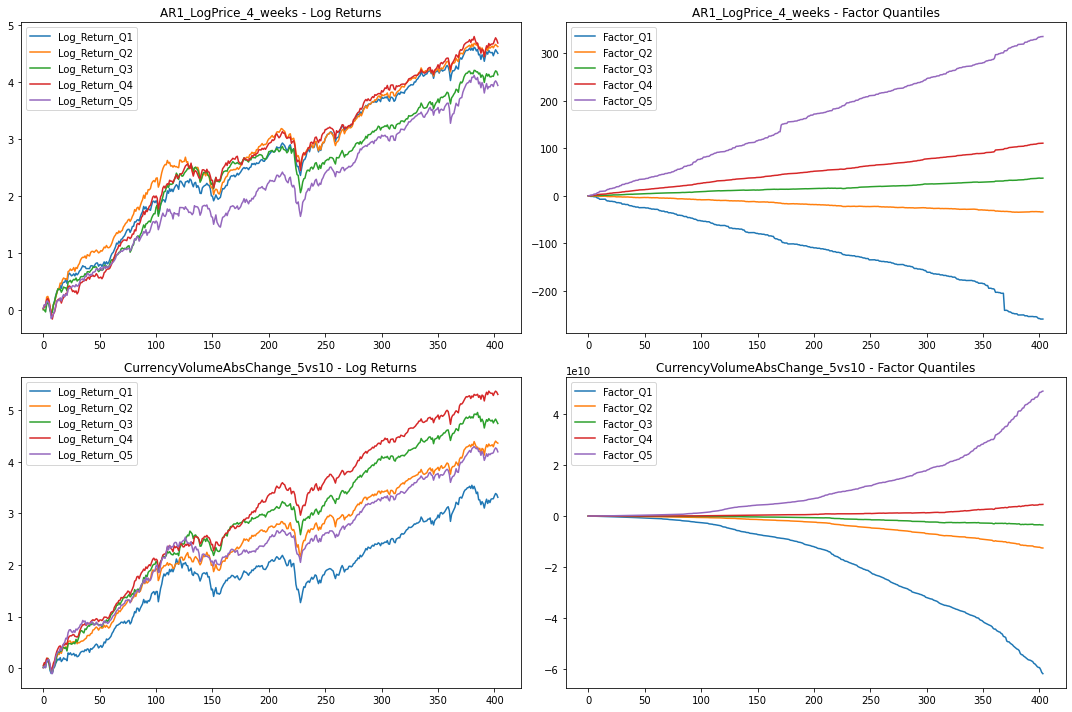
Factor Statistics 1990 – 2023
| Top mover factor within the factor group | T-Stat | P-Value | Direction |
|---|---|---|---|
| CurrencyVolumeAbsChange_5vs10 | 1.2932 | 0.0983 | +1.0 |
| AR1_LogPrice_4_weeks | 0.9718 | 0.1658 | -1.0 |
In the table, we can see the T-Stat and P-Value for the entire period of history for which we evaluate the factors, i.e. 1990 – 2023. The Direction value shows the direction in which the factor affects the movement of the share price, +1 expresses the positive impact of the increasing factor on the share price, and -1 expresses the negative impact of the increasing value of the factor on the share price.
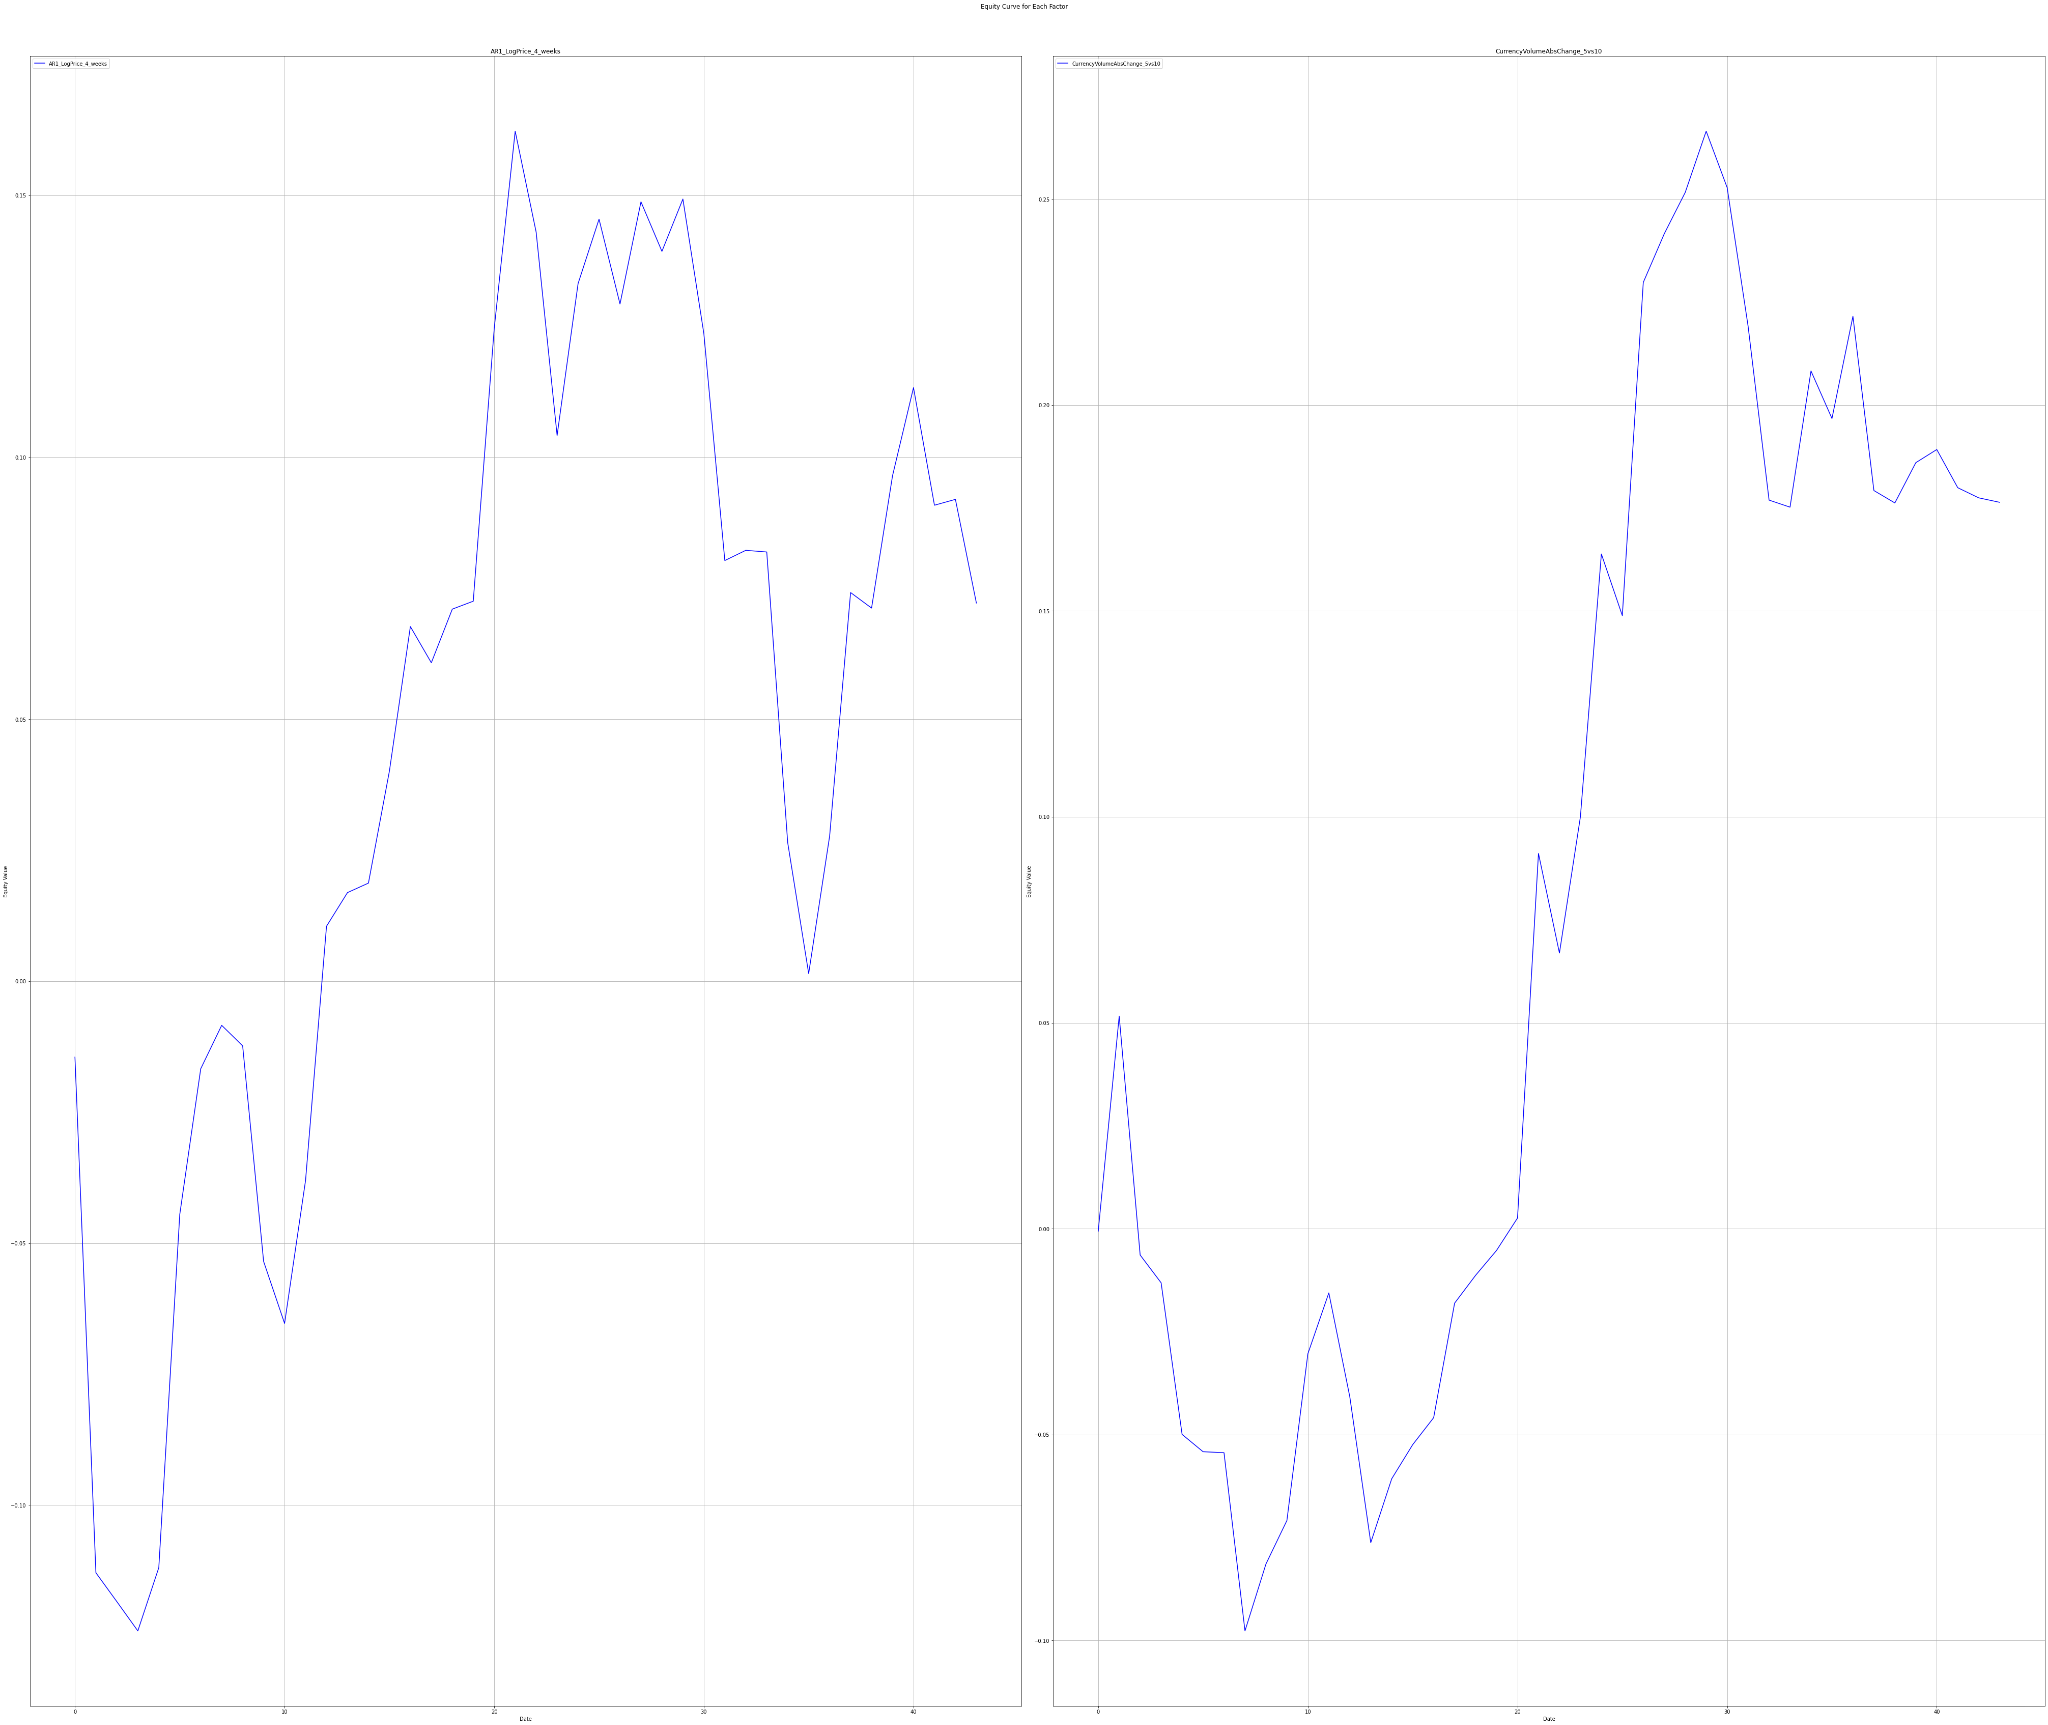
The charts below show Factor Statistics 1990 – 2023 for the 2 selected factors from the previous week.
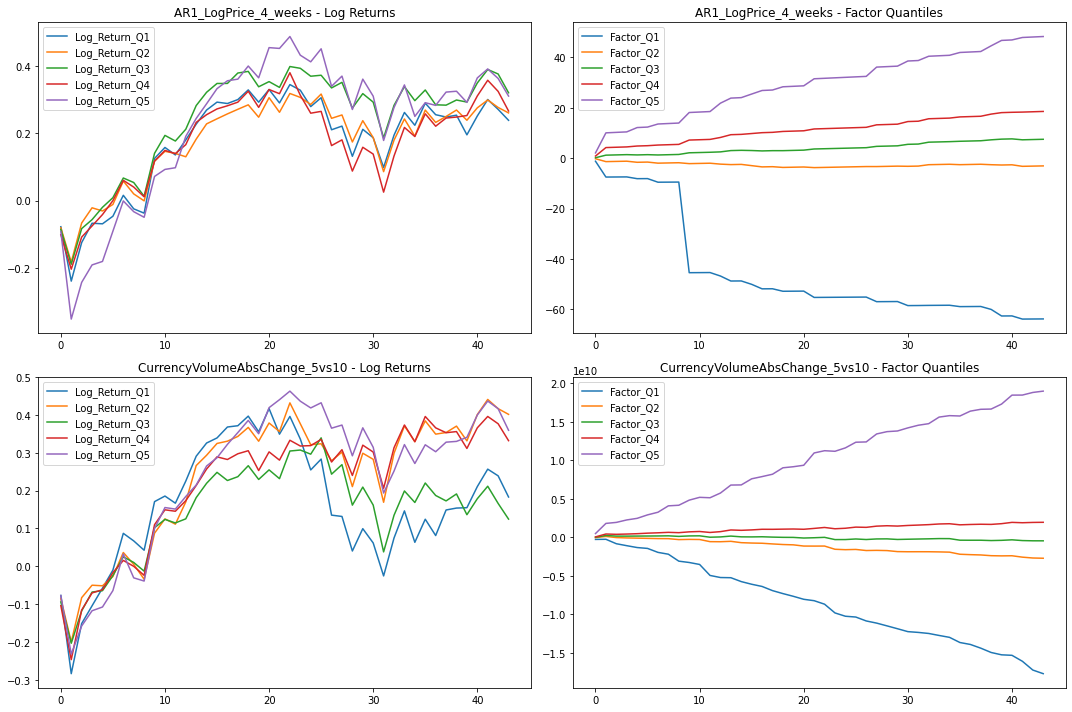
Factor Statistics 2020 – 2023
| Top mover factor within the factor group | T-Stat | P-Value | Direction |
|---|---|---|---|
| CurrencyVolumeAbsChange_5vs10 | 0.8524 | 0.1993 | +1.0 |
| AR1_LogPrice_4_weeks | 0.3546 | 0.3622 | +1.0 |
In the table for the last 3 years, we can see that the AR1 LogPrice4 Weeks factor had a short-term opposite effect on the share price compared to the whole long-term history!
The charts below show Factor Statistics 2020 – 2023 for the 2 selected factors from the previous week.
Factor Statistics Insights
We can analyze how these two factors performed in the two timeframes that we usually take into consideration.
Let’s first talk about the last 3 years. In the plot of Currency Volume Abs Change 5vs10 there seems not to be any trend between stocks with high values and low values of this feature. This pattern is shown similarly in the long-term plot. All of this is probably due to the high p-value of this feature in both time frames, which makes it non-statistically relevant and useful for a factor portfolio.
Similarly, in the short-term plot of the AR1 Log Price, no clear trend is evident, likely due to high p-values. However, in the long-term analysis, an inverse relationship between AR1 Log Prices and returns becomes apparent. This aligns with expectations, as higher volatility tends to compromise future returns. While a visible division between “high” and “low” ranked quintiles of stocks is observed in the long-term plot, the high p-value of the feature undermines its reliability, failing to meet the necessary standards for robust trustworthiness.
In conclusion:
- The Currency Volume Abs Change 5vs10 factor didn’t perform well both in the long and the short term time frame.
- Evaluating the AR1 Log Price factor, we can observe a trend over the long period but due to the high P-Value, it does not meet the necessary standards for robust trustworthiness.