In Factor Investing Even the Best Can Lose – Data-Driven Insights into Factor-Based Analysis

In Factor Investing Even the Best Can Lose – Data-Driven Insights into Factor-Based Analysis
Introduction to factor investing
Factor investing is an intriguing approach to designing a strategy that has gained traction among both retail and institutional investors. By focusing on specific characteristics, or “factors”, investors aim to achieve superior returns. This article delves into the complexities of factor investing, offering data-driven insights to help you make more informed investment choices.
“I Believe” vs. “Just Show Me…”
When it comes to factor investing, the first hurdle is selecting the right factors. There are generally two main approaches: you either “believe” in the power of a specific factor, like the “size” factor that suggests smaller companies outperform larger ones in the long run, or you analyze your data to find evidence supporting the effects you aim to capture. While the first approach relies heavily on individual conviction, we’ll explore the latter. Our analysis spans from 1990 to 2023 and considers a diverse range of characteristics, from market momentum to fundamental financial metrics like cash flow and earnings. To avoid redundancy, we’ve filtered out factors that are highly correlated, ensuring each factor brings unique value to the portfolio.
Factor Selection
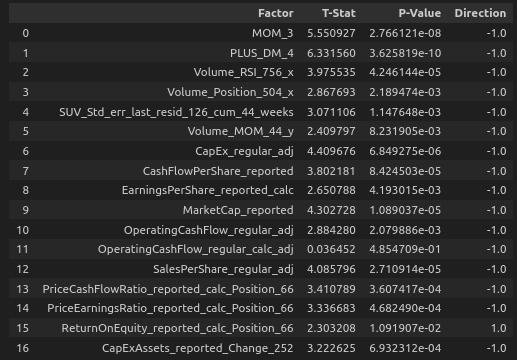
Momentum Factors
(MOM_3, PLUS_DM_4): These show very high T-Stats and extremely low P-Values, indicating strong statistical significance. The direction of -1 suggests they tend to perform better when shorted.
Volume Factors
(Volume_RSI_756_x, Volume_Position_504_x): These factors also show statistical significance but are generally less powerful than the momentum factors.
Fundamental Factors
(CashFlowPerShare_reported, EarningsPerShare_reported_calc): These factors bring fundamental aspects of companies into play and are statistically significant, making them good candidates for a diversified portfolio.
Special Mention (ReturnOnEquity_reported_calc_Position_66): This is the only factor with a positive direction (1.0), suggesting it performs better when bought rather than shorted.
Factors Stability
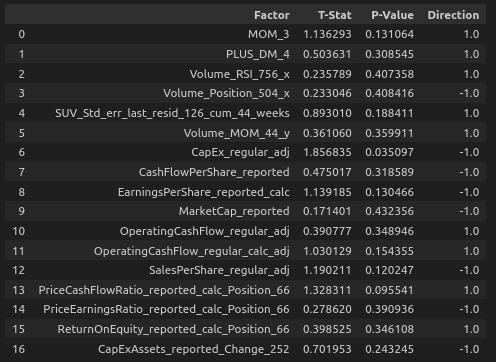
Yes, this is the crucial point of the financial data – a glance at the data from 2020 reveals that many features have shown a significant decay in their effectiveness. This is reflected in their statistical metrics, emphasizing the need for periodic reassessment of the factor selection.
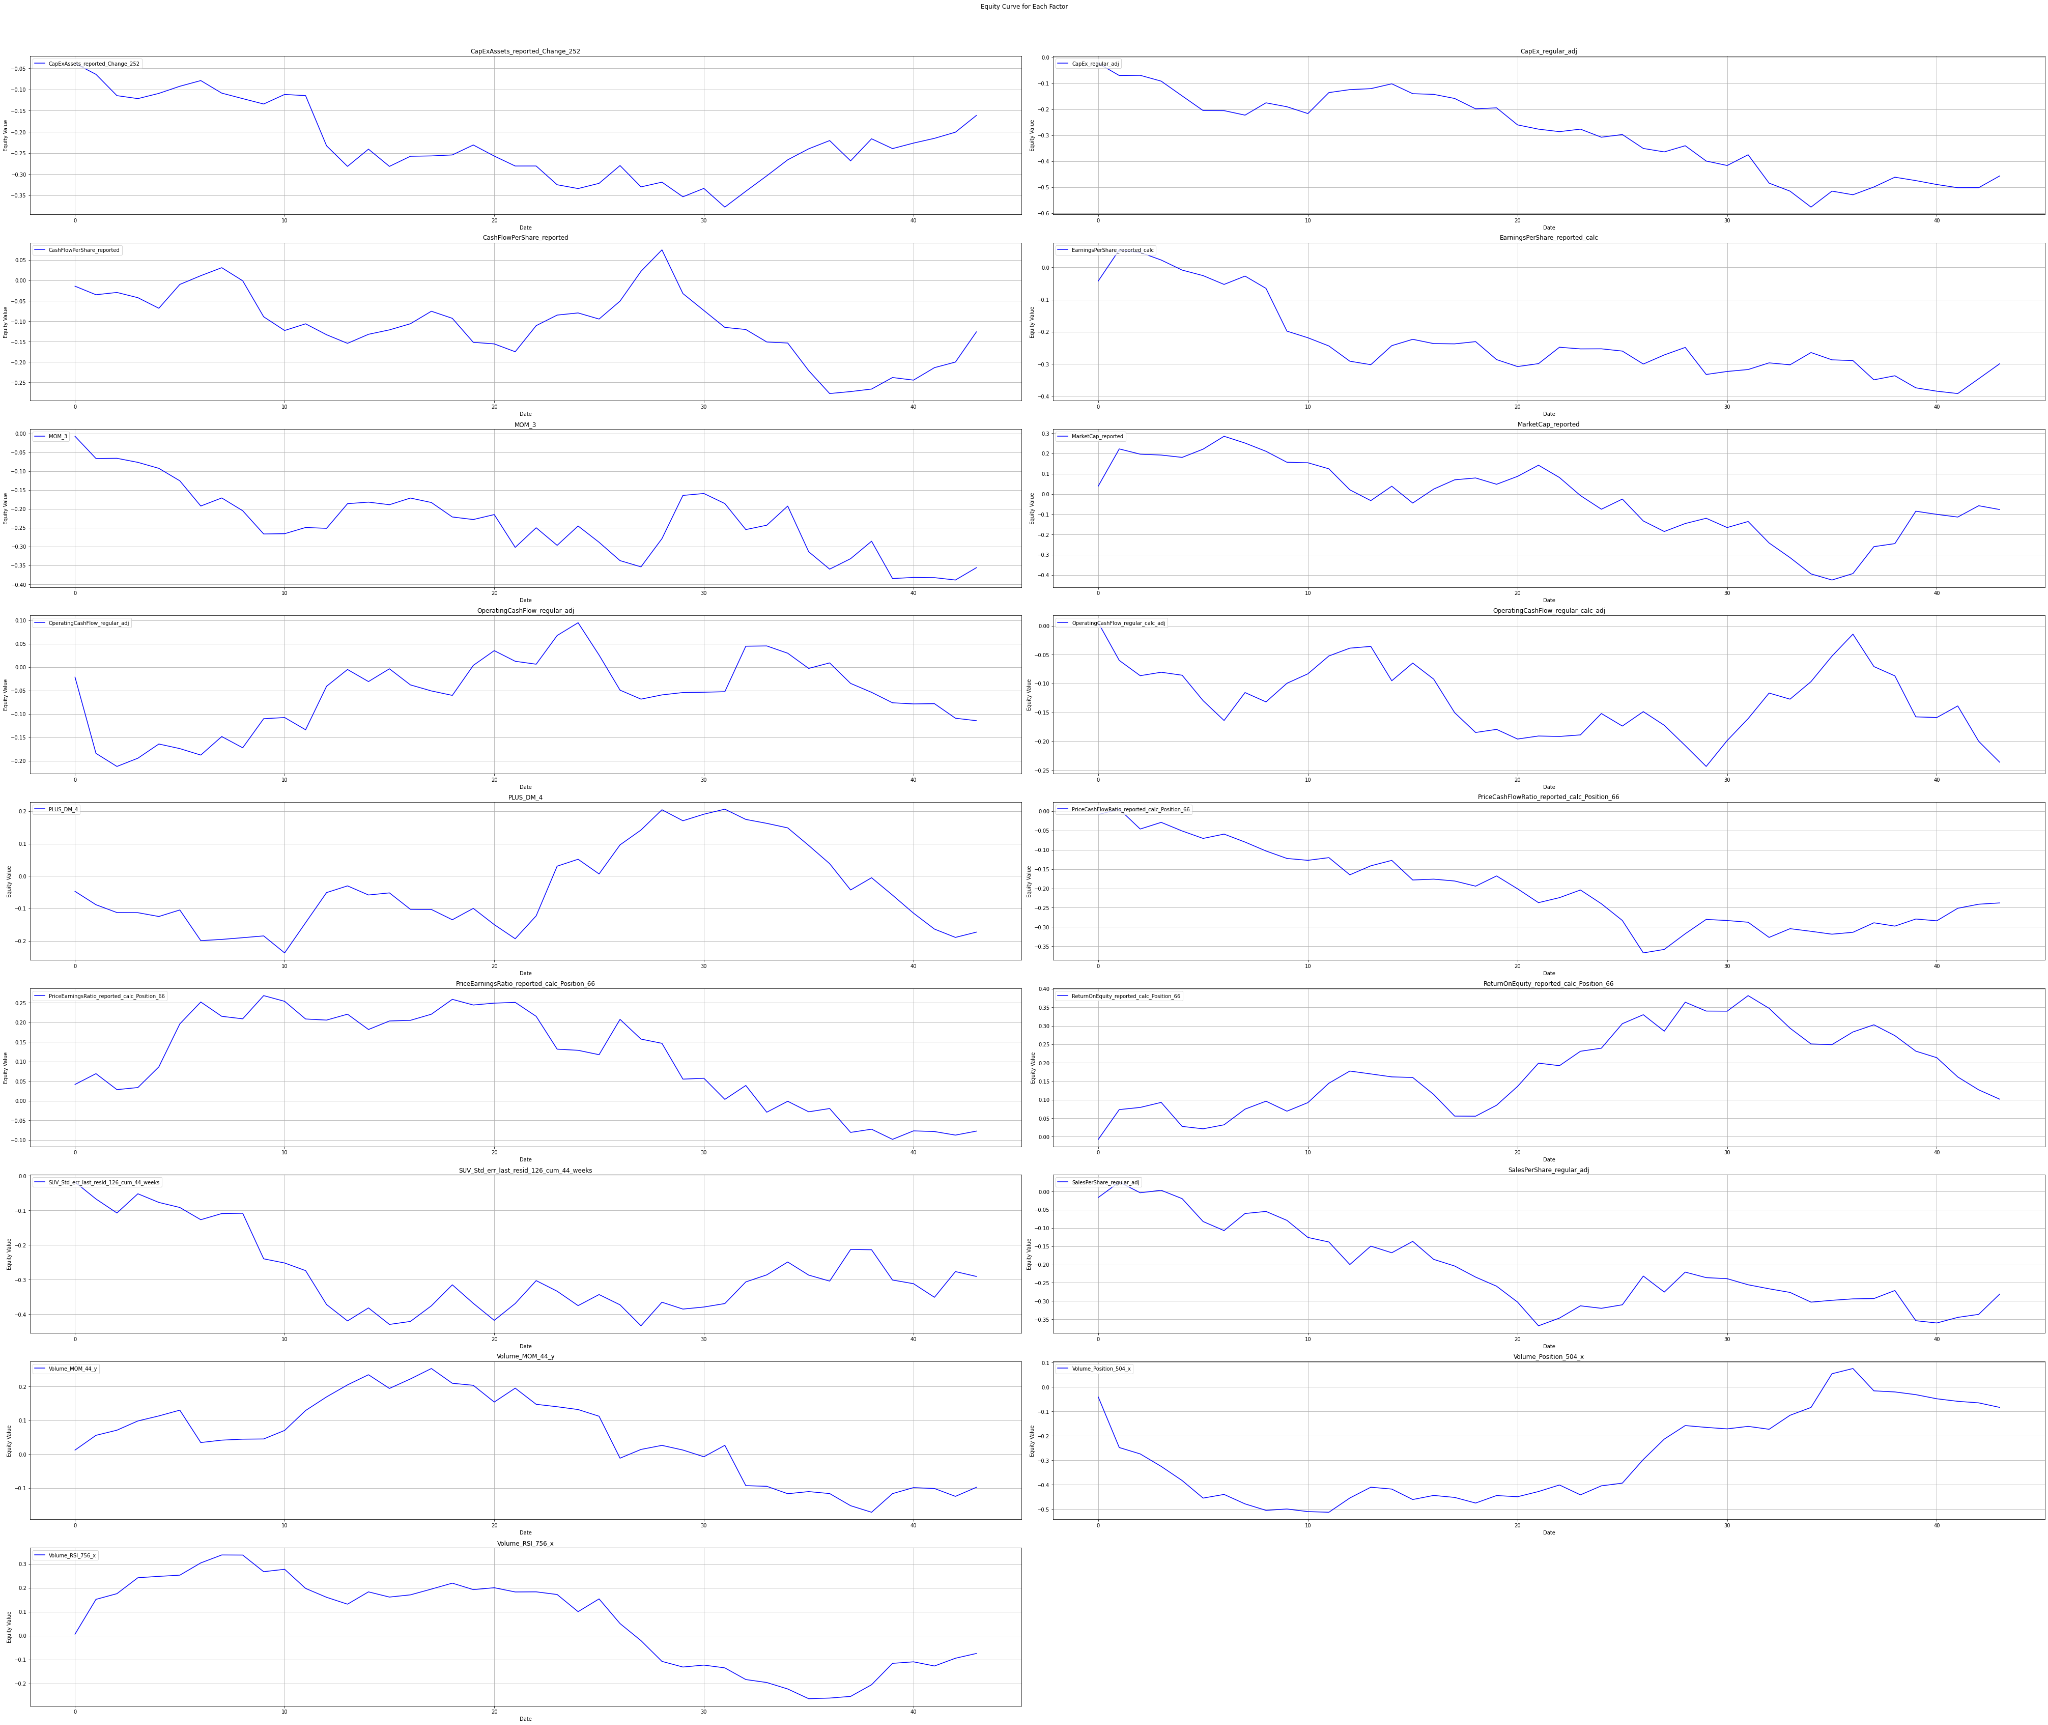
Here’s how these factors have performed in recent years since 2020:
Here’s the comparison of performance between different time frames:
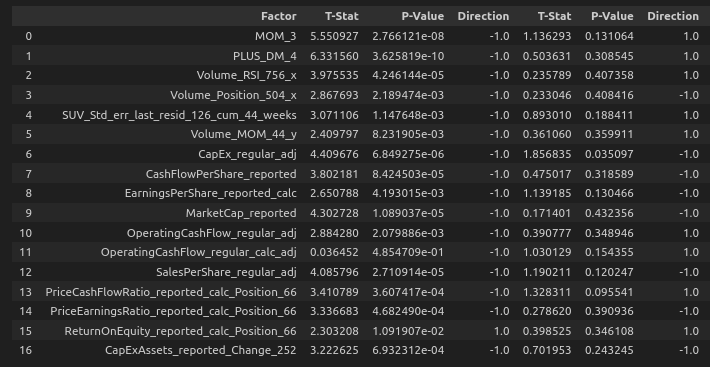
Performance of the factors from 1990 to 2019:
Performance of the factors from 2020 to 2023:
The decay in once-powerful factor’s statistical significance shows the market is adapting, leaving static strategies in the dust. This is a red flag. The lone resilience of Capital Expenditures serves as a cautionary tale—complacency in factor selection is an uncertain business. The decay of factors is a stern reminder that financial markets are dynamic, what worked yesterday may not work tomorrow.
Risk vs. Return
It’s the same tune, just with a different tempo – the “size effect” and the “quality effect.” In the size effect, smaller companies tend, by theory, to generate higher returns than larger ones. On the quality side, companies with higher returns on equity generally outperform their peers. However, let’s delve into the data to understand these patterns.
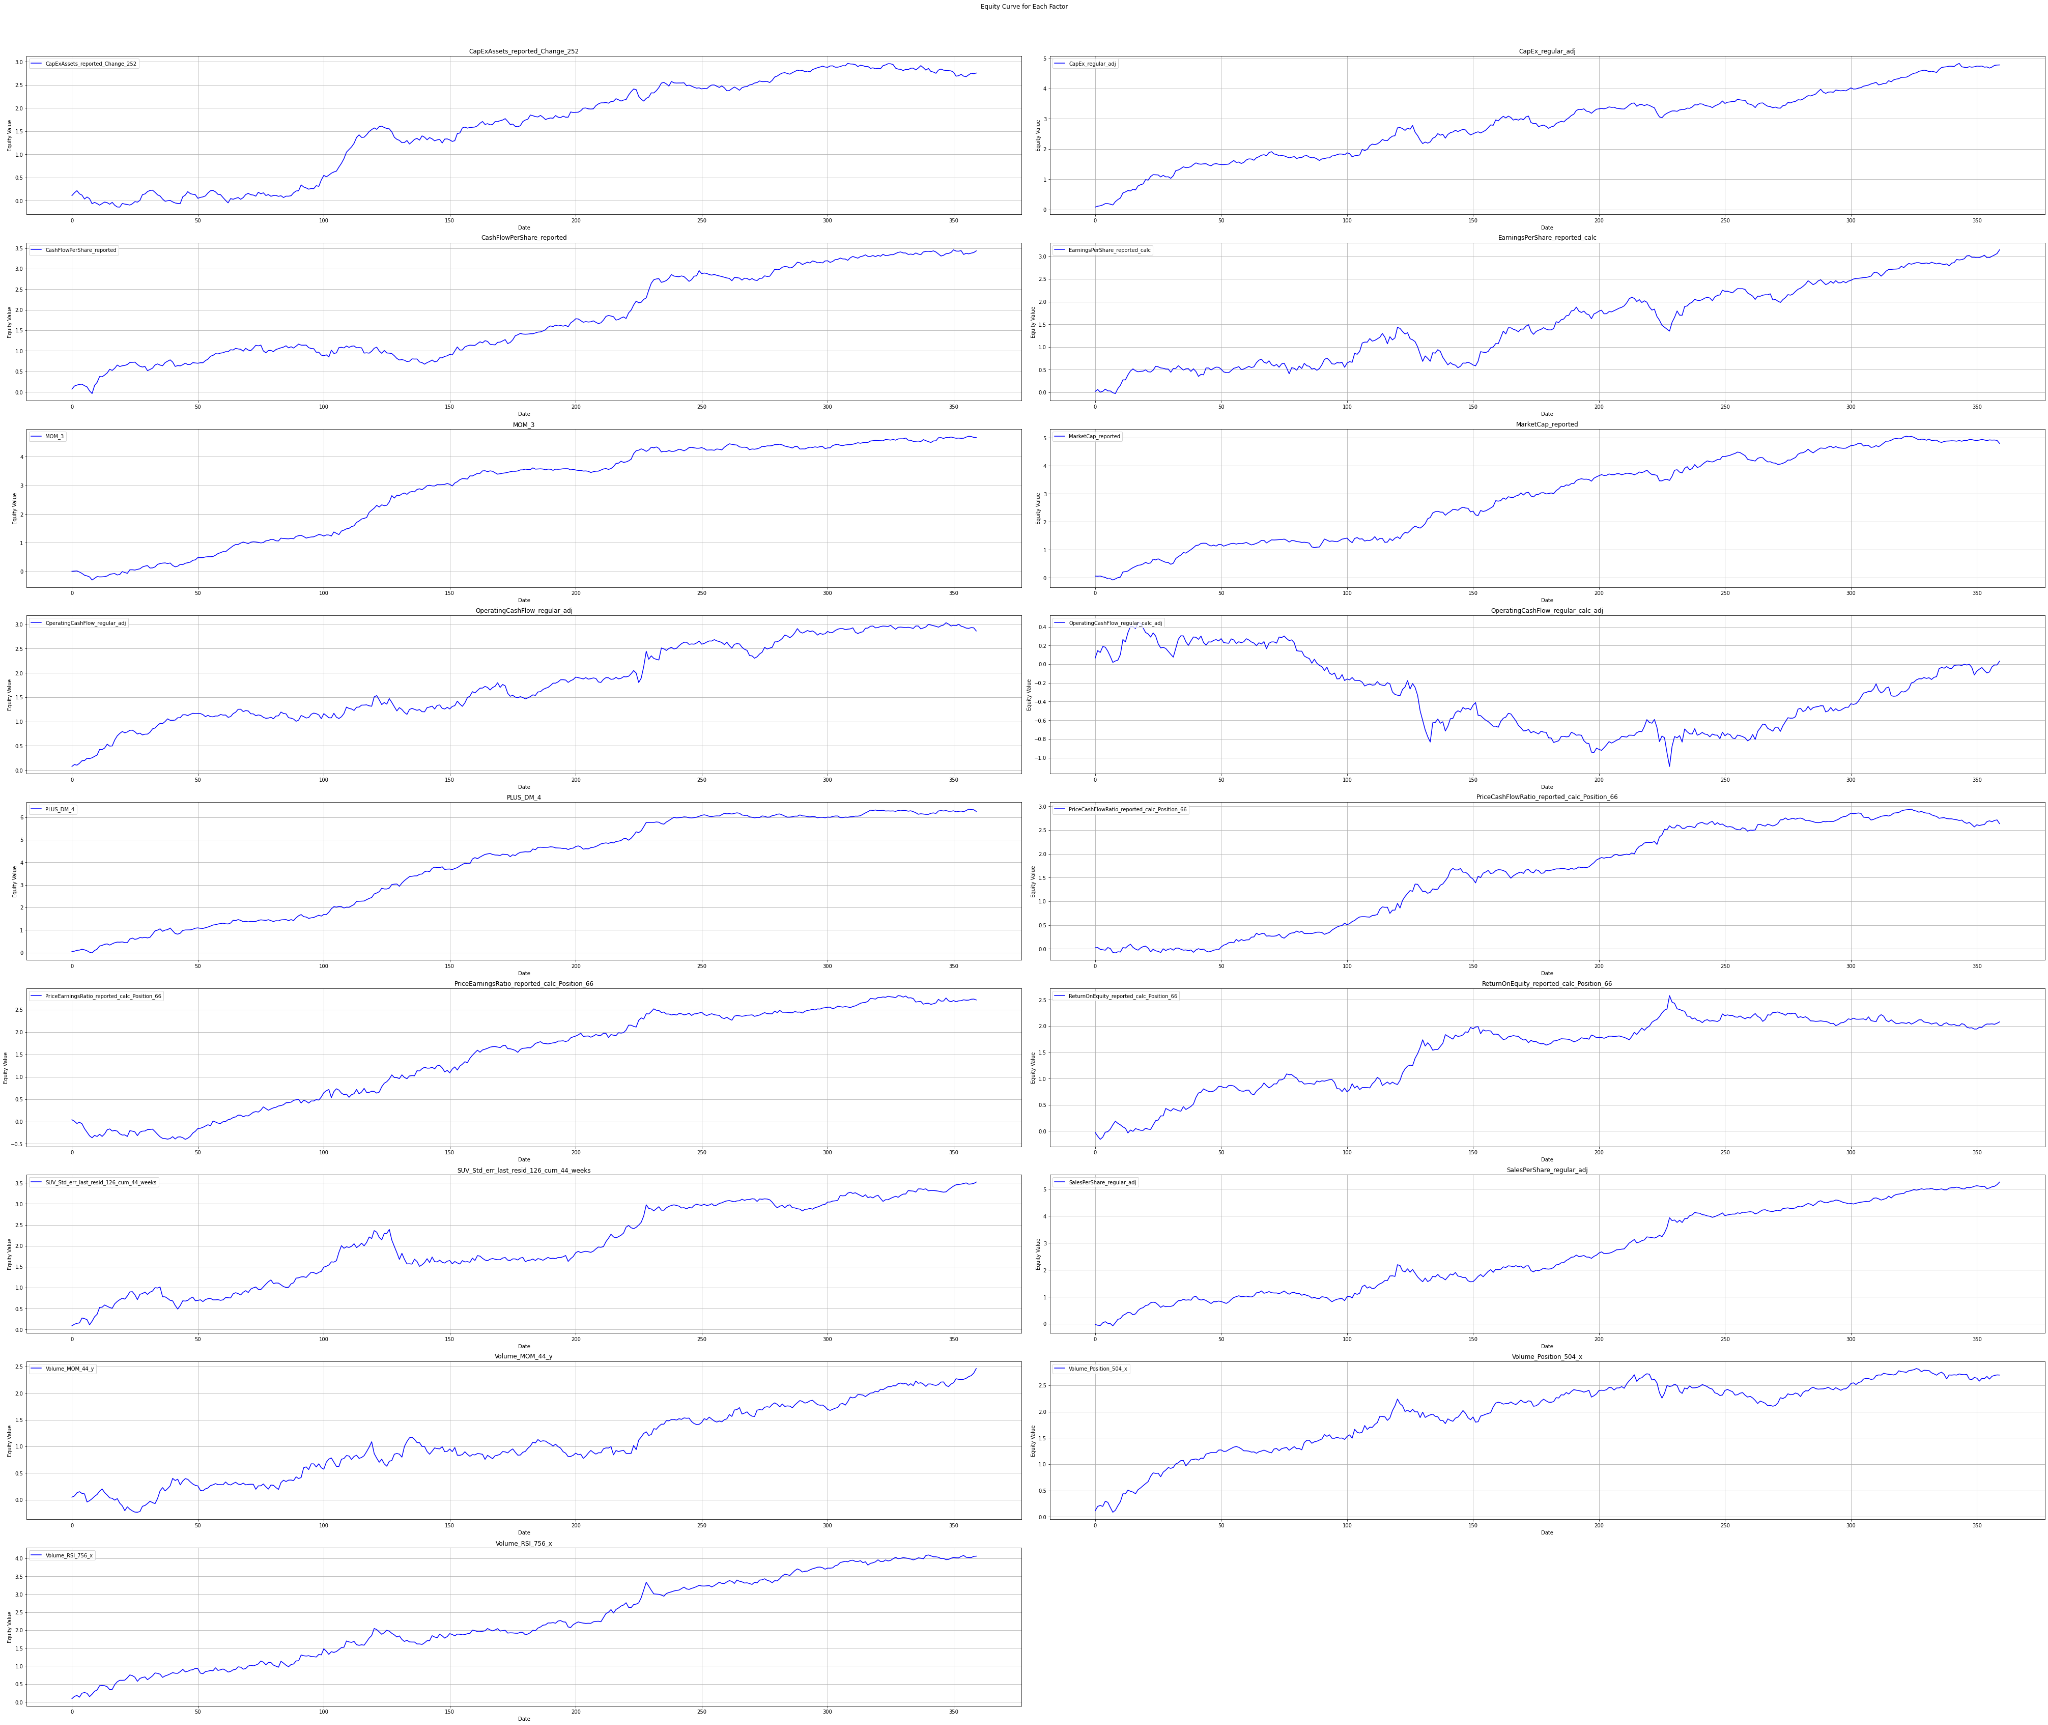
One methodological stop before “revealing the truth” regarded size and growth factors. In the left part of the following graph are cumulative equity curves which represent investments into the stocks sorted and selected by values of an appropriate factor. Values of the factor are in the right part. In other words, imagine dividing factor values across the market into 10 (or 5, etc.) bins. Those bins are considered as portfolios and their equity curves are shown below.
Factors progress 1990 – 2019:
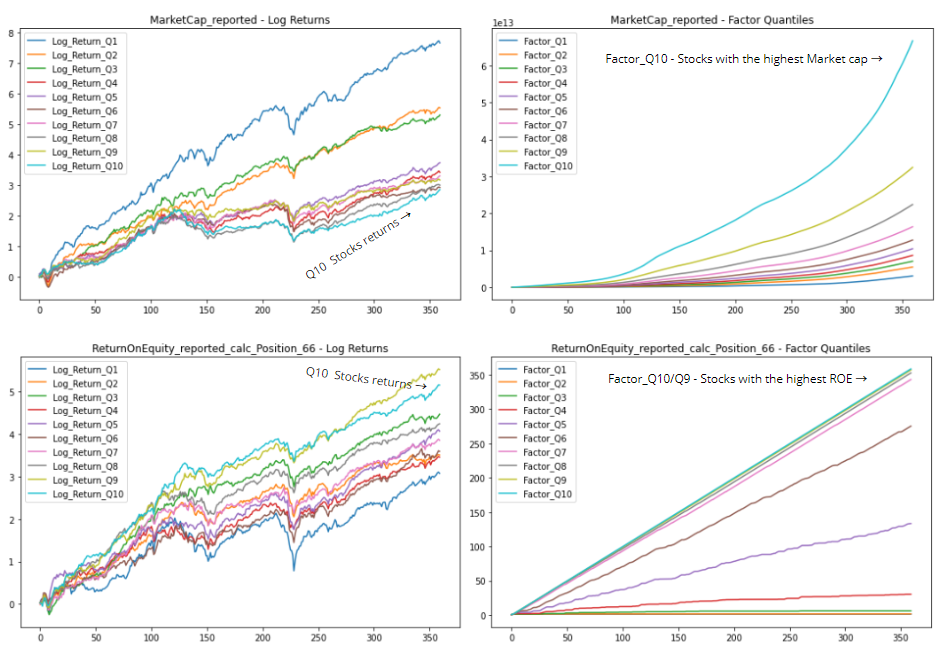
Growth factor = Return on Equity. (The quantiles composed of) Stocks with the highest ROE (Factors_Q10+Q9 ) grow the fastest. Turquoise and beige lines, blended in the bottom right part of the picture.
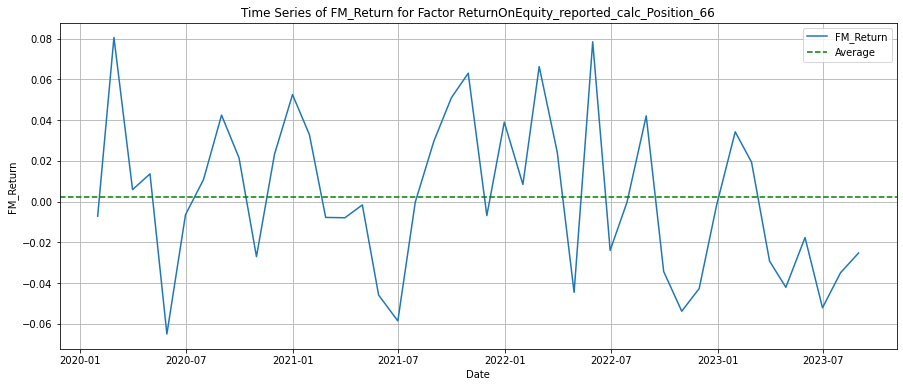
Now back to our case study – in the plot below are monthly returns for a long-short portfolio (difference between the first and 10th bin) which shows returns dynamic and its average value.
Return on Equity Factor Progress 2020 – 2023:
Market Capitalization Factor Progress 2020 – 2023
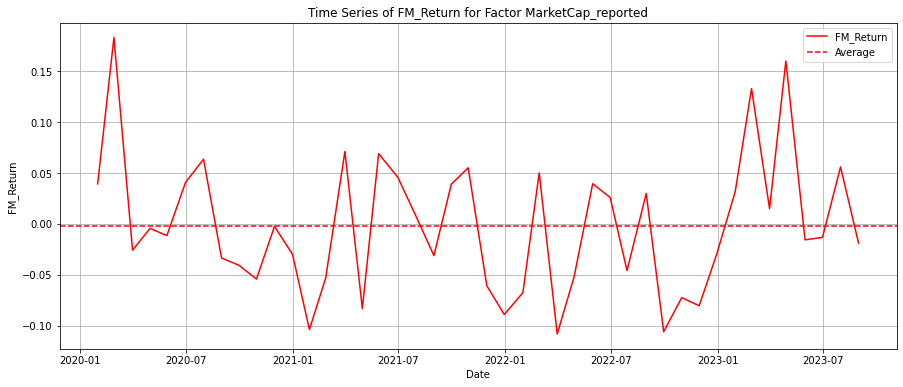
In the analyzed period 2020 – 2023 growth factor on the first plot yields a positive monthly return rate of 0.23% (green dashed line), while the size effect on the second plot proved to be negative, bringing on average -0.17% monthly returns (red dashed line).
This means, if you believed in the growth factor in 2020, you would be right and you would gain positive returns (+0.23% monthly on average). Whereas if you were to bet on size factor in 2020, your portfolio would struggle with an average monthly return of -0.17%.
What is good and what is wrong?
The Inconsistency of Market Capitalization
Market Capitalization (MarketCap_reported) is a standard indicator for assessing company size. However, our data shows that it comes with high volatility and a negative Sharpe ratio (-0.02). This means that while it can offer high returns, the associated risks are substantial. This fact was visible, particularly in the technology sector where technology giants went down to drive a rally up to the summer of 2023, i.e. the size effect appears to be nondeterministic in recent years.
The Consistency of Return on Equity
In contrast, Return on Equity demonstrates remarkable stability and has a history of good performance (quality factor). This makes it a safer bet for those looking for steady returns. The rationale is straightforward: companies that can generate higher relative profits tend to be a more reliable investment. Believe me, this consistency of intuition and data is not for granted at all.
Conclusion
Factor investing isn’t a ‘one-size-fits-all’ approach. It requires deep insight, continuous adjustment, and fine-tuning. Market Capitalization can be a rollercoaster—high returns but risky. On the other hand, Return on Equity is your steady workhorse, consistently bringing in solid returns
If you’re keen on diving deeper and customizing your own investment strategy, sign up for our newsletter, follow us on LinkedIn, or let us know that you want to be our test user of the advanced version of our software. We would love to give you beta account credentials for our software analyzing the importance of factors during the selected timeframes. Basic factor analysis is already in our production version of the Analytical Platform application, namely in the Report detail section.
The article is part of the series focusing on Factor investing. Take a look at the previous article What are the Best Factors for Factor Investing? Interesting insight into this topic provides also our previous article Stock Analysis with AI.