Equity – Configuration of Investment Strategies
Equity – Configuration of Investment Strategies
Welcome to the installment of our ‘Configuration of Investment Strategies’ series, where we delve into the critical aspect of evaluating financial performance—the Equity at the end of the period table. Understanding how each investment strategy translates into actual returns is crucial for investors looking to make informed decisions and maximize their portfolio growth.
Equity at the end of the period
The Equity at the end of the period table provides a tangible representation of the financial outcomes of different investment strategies. This metric is especially valuable as it reflects the final value of an initial investment, allowing investors to gauge the practical impact of each strategy on their wealth.
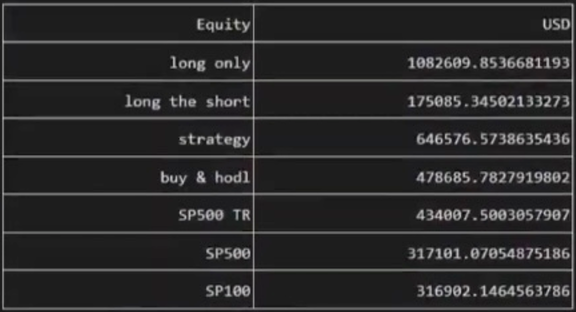
Let’s explore the equity results based on our tested settings:
Long Only: $1,082,000
The Long Only strategy, tailored for risk-tolerant investors, would have resulted in an impressive end-of-period equity of $1,082,000. This suggests that investors comfortable with a moderate level of volatility could have substantially grown their initial investment.
Long the Short: $175,000
For those focused on risk control through shorting stocks, the Long the Short strategy,, yielded an end-of-period equity of $175,000. This is expected, since the stocks that are part of the Short Strategy are the one that are expected to growth the least and they would be just used to limit risk and volatility.
Strategy (Long and Short): $646,000
The comprehensive Long and Short strategy, incorporating both long and short positions, resulted in an end-of-period equity of $646,000. This indicates that not only does this strategy outperform its benchmark (see below), but it does so with a balance of risk and stability (based on the previous mentioned metrics in our series), making it appealing to investors aiming for both growth and security.
Benchmarking Equity
S&P 500 TR: $434,000
The S&P 500 Total Return index, considering dividend reinvestments, matches the Buy & Hold strategy’s end-of-period equity at $434,000.
Buy & Hold: $478,685
This benckmark consist in backtesting how a pool of stocks comprised by the current sp100 would have performed. It yielded and end-of-period equity of $478,000
S&P 500: $317,000
The S&P 500 index, reflecting the risk inherent in a market, yielded an end-of-period equity of $317,000.
S&P 100: $316,000
Similarly, the S&P 500 index, resulted in an end-of-period equity of $316,000. This is considered our main benckmark since we pick our stocks from this pool. Outperforming this benckmark means that our strategy have the ability to divide winning and non-winning stocks.
Similarly, our configuration tool provides information about:
Equity with regular rebalancing. This metric is important for users who fills the Invest every rebalance field in the initial setting of the configurator. This feature is being used mostly by mutual funds.
Return over Maximum drawdown, where we divide the total return by the maximum drawdown with the simple formula: RoMaD = portfolio return ÷ maximum drawdown. The result gives us insight into how efficiently our investment strategy generates returns while managing risk. Read more about RoMaD in our article.
Was the articles useful for you? Contact us and use Strategies Configurator for building and evaluating your investment strategies. If you want more info about how we use the rating of the stocks to create the different strategies read about it here.