Return Over Maximum Drawdown (RoMaD) – Configuration of Investment Strategies

Return Over Maximum Drawdown (RoMaD) – Configuration of Investment Strategies
In this article from our “Configuration of Investment Strategies” series, we introduce a key performance metric called RoMaD Equity. RoMaD, which stands for “Return over Maximum Drawdown”, provides valuable insights into how well our investment strategies are performing.
Now, let’s break down what RoMaD really means
Return over Maximum Drawdown
- RoMaD is an essential metric in the world of finance and investment. It helps us understand the relationship between the returns we get from our investment strategies and the worst losses we experience over a specific time frame. In simple terms, RoMaD tells us how well our investment strategy rewards us in comparison to the risks it carries.
- Return: This part of the metric represents the total profit we make from a strategy
- Maximum Drawdown: On the flip side, maximum drawdown is the most substantial drop in the value of our investment during a specific period.
To calculate RoMaD, we divide the total return by the maximum drawdown with the simple formula: RoMaD = portfolio return ÷ maximum drawdown. The result gives us insight into how efficiently our investment strategy generates returns while managing risk.
A higher RoMaD means that the strategy provides more returns compared to the worst losses, making it an attractive choice for those who want a good balance between profit potential and risk management. On the other hand, a lower RoMaD suggests that the strategy may not compensate enough for the risks it carries.
In summary, RoMaD is a useful tool for assessing how well our investment strategies perform while considering the risks involved. It helps investors make informed decisions aligned with their financial goals and risk tolerance.
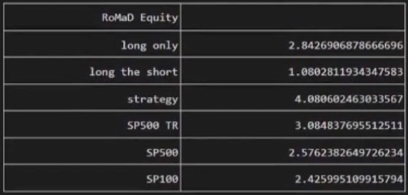
Now, let’s look at the RoMaD Equity values for different strategies:
Results of Investment Strategies
- Long Strategy (Often referred to as “Aggressive”): Our long-only strategy consists of buying and holding the top Quintile of stocks from our stock pool. If you want to gather more information about how we divide stocks in pools from the ones with the higher scores to the lowest you can read about it in our article here. The strategy has a RoMaD Equity of about 2.84. This means that for every unit of risk, this strategy has generated a return of 2.84 units, showing that it offers returns with limited downside risk.
- Long the Short Strategy: The RoMaD Equity for our long the short strategy is approximately 1.08. This strategy has a lower RoMaD Equity compared to the Long strategy, which means that compared to how much drawdown it experienced the the returns were not very high. This is expected since the Long the Short strategies are taking into consideration the worse quintile.
- Strategy (Often referred to as “Long Short”): Our combined strategy works by at the same time longing for the best quintile as in the Long Strategy and shorting the worse quintile (Opposite than in Long the Short Strategy).
This is great for risk management and in fact, it has a RoMaD Equity of 4.08, indicating strong risk-adjusted performance. This approach delivers significant returns relative to its low losses.
Now, let’s compare these strategies to some benchmark indices:
Results of Benchmark Indices
- S&P 500 Total Return: The RoMaD Equity for the S&P 500 Total Return index is 3.08. This benchmark gives us a point of reference for evaluating how our strategies perform in comparison to a widely recognized market index.
- S&P 500: The RoMaD Equity for the standard S&P 500 index is 2.57, which is an essential comparison, especially if you want to see how our strategies stack up against the broader market.
- S&P 100: The RoMaD Equity for the S&P 100 is 2.42. This narrower index, consisting of 100 large-cap stocks, it’s the closest index that we use to compare our strategies since our pool of stocks is composed almost identically by the stocks in the S&P100.
Was the articles useful for you? Contact us and use Strategies Configurator for building and evaluating your investment strategies.