What is Yield Curve? Why is It Important?

What is Yield Curve? Why is It Important?
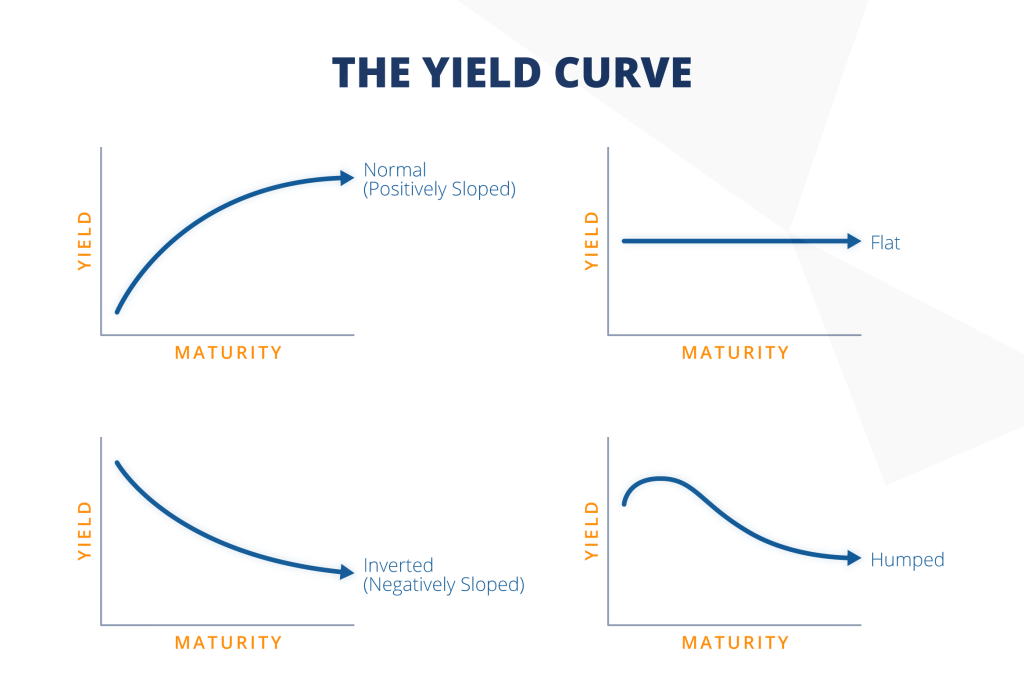
The yield curve depicts the relationship between the yield on government bonds of various maturities graphically. It is an essential tool used by financial analysts and investors to assess the state of the economy and decide which investments to make. The yield curve is crucial because it offers insightful data on the status of the economy and forecasts upcoming economic activity. This is so that we can predict the future course of interest rates and inflation based on the yield curve’s slope.
Long-term bonds often provide a greater yield than short-term bonds because the yield curve typically slopes upward. Due to the risk involved in locking up their money for long periods of time, investors expect a greater yield. We can learn information about the current state of the economy from the yield curve’s slope. A yield curve that slopes steeply upward denotes the economic expansion and the potential for rising inflation, while a yield curve that is flat or inverted denotes a downturn in the economy.
A flat yield curve indicates that the yields on long-term and short-term bonds are nearly equal. This suggests that investors are unsure about how interest rates and inflation will develop in the future. A flat yield curve may also be a sign that the market is transitioning from an expanding to a collapsing economy.
If the yield curve is inverted, it indicates that long-term bond yields are lower than short-term bond yields. Because investors normally want a higher interest for locking up their money for longer periods of time, this is an uncommon circumstance. Investors anticipate lower interest rates in the future when the yield curve inverts.
A recession can be accurately predicted by an inverted yield curve. This is due to the fact that it shows that investors are gloomy about the future course of the economy. Investors purchase long-term bonds to lock in greater yields when they anticipate a recession because they believe interest rates will decline in the future. As a result, long-term bond yields decline, inverting the yield curve.
The Federal Reserve frequently reduces short-term interest rates during a recession in an effort to boost the economy. As a result, the yield curve may steepen, a promising indication for the economy. The economy may not be responding to the Fed’s efforts to stimulate it, though, if the yield curve stays inverted or flattens even further. This is a warning indicator for the economy and the stock market.
The yield curve can be used to forecast changes in the stock market. An impending recession can be accurately predicted by an inverted yield curve, according to research. An inverted yield curve can indicate a bear market because the stock market traditionally performs poorly during recessions.
The cost of borrowing for both individuals and corporations is impacted by the yield curve. Banks are more motivated to lend money to businesses and individuals when the yield curve is steep because they may make money by borrowing at low short-term rates and lending at higher long-term rates. Banks might be less eager to lend, though, if the yield curve is inverted, as they stand to gain more from buying short-term bonds. A credit crunch could result from this, making it harder for people and businesses to get loans.
Making informed financial decisions requires having a solid understanding of the yield curve and its ramifications. The yield curve can be used by analysts and investors to evaluate the status of the economy and guide their investment choices. For instance, investors may think about buying long-term bonds or equities if the yield curve is steep in order to benefit from the anticipated economic expansion. Conversely, if the yield curve is inverted, investors can think about putting their money in short-term bonds or cash to hedge against the anticipated economic slump.
In conclusion, a yield curve is an essential tool for understanding the state of the economy and making investment decisions.
What is happening on the market now? What might be expected?
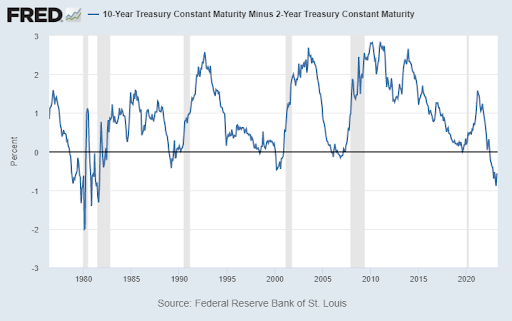
Since 1955, the 2/10-year yield curve has inverted six to 24 months ahead of every recession, according to a 2018 study by San Francisco Fed researchers. There was only one false signal over the period. The portion of the yield curve between one-year and ten-year yields was the focus of that study.
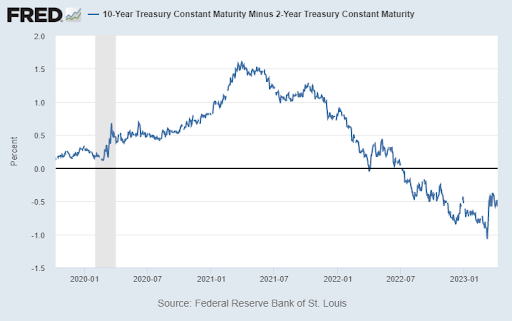
However, after the SVB incidents, a potential FED policy pivot is now considered more likely, and due to that fact, the inversion is now in better shape (despite still being in the negative zone).
According to historical data, the chance of a potential recession in near future should be seriously considered by policymakers.
Of course, it might not happen as well; however, regarding the historical data, it seems there might be a recession in near future.
DISCLAIMER: THIS TEXT CONTAINS NO INVESTMENT ADVICE.