Value at Risk – Configuration of Investment Strategies

Value at Risk – Configuration of Investment Strategies
Welcome to the next blog post of our ‘Configuration of Investment Strategies’ series, where we delve into the crucial concept of ‘Value at Risk’ (VaR) across various confidence levels—90%, 95%, and 99%. Understanding VaR is important for investors seeking to gauge the potential losses their portfolios may face under different scenarios.
What is Value at Risk?
Value at Risk is a risk metric that quantifies the maximum expected loss within a given time frame and confidence level.
For example, if a portfolio of stocks has a one-month 95% VaR of $1 million (it can be measured in x% too), that means there is a 95% chance that the losses will not surpass 1$ million.
While there is a 5% (100%-95%) probability that the portfolio will fall in value by more than $1 million over the analyzed period.
In our analysis, we assess VaR at 90%, 95%, and 99% confidence levels to offer a comprehensive view of potential risk exposure measured over our rebalancing period, which is one month (In this example series of articles, the metric can be changed in the setting).
Invest in the forces that move stock prices
Leverage the power of factor investing with revolutionary software
Confidence Levels and Risk Tolerance
Starting with a focus on the 90% VaR, investors gain an understanding of the potential losses that might occur with a confidence level of 90% during the given period.
Moving to the 95% VaR, we observe a slightly wider range of potential losses. This level of VaR is commonly important by investors seeking a balance between risk and return.
For the risk-averse investor, the 99% VaR comes into play. This metric reflects the maximum expected loss with 99% confidence, indicating a more conservative approach. While the potential losses at this level are higher, it appeals to those prioritizing capital preservation and a lower tolerance for risk.
Portfolio Comparison with Specific Values
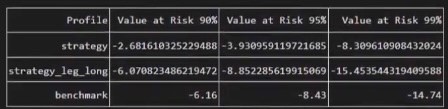
VaR 90:
- Strategy Portfolio: -2.68%. To clarify, a VaR 90 value of -2.68% indicates a 10% chance that losses will exceed 2.68% during our test period. Conversely, there is a 90% chance that losses will not exceed 2.68%.
- Aggressive Portfolio: -6.07%. A VaR 90 value of -6.07% implies a 10% probability of losses exceeding 6.07%, with a 90% chance that losses will stay below this threshold.
- Benchmark: -6.16%. Similarly, a VaR 90 value of -6.16% indicates a 10% likelihood that losses will surpass 6.16%, while there is a 90% chance they will not.
VaR 95:
- Strategy Portfolio: -3.93%. For a VaR 95 value of -3.93%, there is a 5% chance that losses will surpass 3.93%, and a 95% chance that losses will be below this level.
- Aggressive Portfolio: -8.85%. A VaR 95 value of -8.85% suggests a 5% probability of losses exceeding 8.85%, with a 95% chance that losses will not exceed this threshold.
- Benchmark: -8.43%. Similarly, a VaR 95 value of -8.43% indicates a 5% likelihood of losses surpassing 8.43%, with a 95% chance they will stay below.
VaR 99:
- Strategy Portfolio: -8.30%. Explaining a VaR 99 value of -8.30%, there is a 1% chance that losses will exceed 8.30%, and a 99% chance that losses will not surpass this level.
- Aggressive Portfolio: -15.45%. A VaR 99 value of -15.45% implies a 1% probability of losses exceeding 15.45%, with a 99% chance that losses will stay below this threshold.
- Benchmark: -14.74%. Similarly, a VaR 99 value of -14.74% indicates a 1% likelihood of losses surpassing 14.74%, with a 99% chance they will not exceed this level.
If you want more info about how we use the rating of the stocks to create the different strategies read about it here.
Was the articles useful for you? Contact us and use Strategies Configurator for building and evaluating your investment strategies.