Distribution of Rebalance Returns – Configuration of Investment Strategies

Distribution of Rebalance Returns – Configuration of Investment Strategies
In this article from our series on “Configuration of Investment Strategies“, we’re introducing a critical performance metric. The Distribution of Rebalance Returns is a useful way to visualize how returns are spread out across different probabilities in an investment strategy.
Let’s clarify what a probability distribution means in the context of finance and investments.
A probability distribution
A probability distribution, in finance, is a mathematical function that tells us how likely various outcomes are. It helps us understand the range of possible returns from an investment strategy and the likelihood of each of those returns occurring.
In the case of the Distribution of Rebalance Returns, this probability distribution is an essential tool to evaluate the risks and potential rewards of their strategy. It basically shows us how returns are distributed across different possibilities, providing a comprehensive analysis of the strategy’s performance.
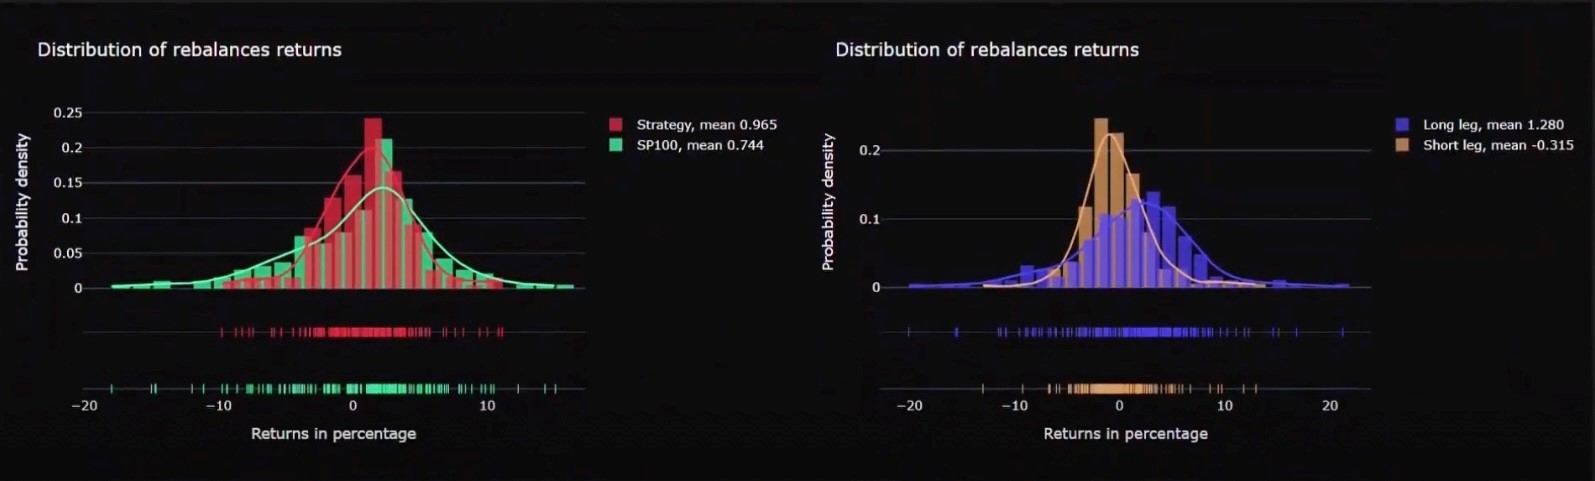
In this graph, the Y-axis represents the probability density, and the X-axis shows the return of the investment strategy in terms of a percentage. Probability density indicates the likelihood of a specific return within the distribution.
Think of the Y-axis as a way of showing how returns are spread across the range of possibilities. Higher probability density at a specific point means a higher chance of getting a return near that point, while lower density means a lower chance.
Now, let’s zoom in on a key aspect of the probability distribution – the mean.
The mean of a probability distribution
The mean of a probability distribution, also known as the expected value or average, is a measure of the central tendency of the distribution. It tells us the long-term average or the “typical outcome” when a random experiment is repeated many times.
Invest in the forces that move stock prices
Leverage the power of factor investing with revolutionary software
A sample demonstration
Now, comparing the first plot, which showcases our Strategy alongside the SP100 benchmark our Long-Short strategy has a mean of 0.965, while the SP100 has a mean of 0.744. This means that, on average, for each rebalancing period (monthly in our case), our strategy returned 0.965%, and the SP100 returned 0.744%.
We can also analyze our long and short strategies. Just to recap, the long strategy involves the top-rated stocks, while the short strategy consists of the worst-rated stocks, used to build our balanced or aggressive strategy.
If you want more info about how we use the rating of the stocks to create the different strategies read about it here.
When we look at the Long strategy, which selects the top 20 rated stocks, we see that the mean of our probability distribution is 1.280, while for the shorted stocks, the mean is -0.315.
These numbers quickly show that the Long strategy is better suited for a more aggressive approach. The distribution plot also reflects this, showing a wider range and, therefore, more volatility in this strategy.
The Short strategy is the one that has lower returns but more stability, and it’s optimal for creating a balanced risk-averse portfolio.
Was the articles useful for you? Contact us and use Strategies Configurator for building and evaluating your investment strategies.