The Backtesting Logic Behind Pattern Lab

The Backtesting Logic Behind Pattern Lab
The following article describes the backtesting logic of our pattern-finding application.
The testing procedure uses an event-based backtesting system that checks pattern occurrence in each step. After the occurrence is observed, the appropriate orders (entry order and two exit orders – stop loss and profit target) are established. The entry price is set up by the type of order – the vast majority of the orders are market orders. Every entry order should be followed by two other orders – stop loss and take profit. Stop-loss is a stop order type that is executed as a market order at a specific level (auxiliary price as a stop-loss price level). Take profit is a limit order type executed at a prespecified price level (limit price as a take profit price level).
The fast backtesting system uses only daily data leading to approximate results. The state machine evaluates every timestamp as a specific step and decides whether to enter or exit new trades.
Before Trading Starts
Every testing period starts by specifying your starting capital, testing period, candlestick pattern, gain per trade, and accepted risk (loss) per trade.
Each Step
As mentioned above, the backtesting engine looks for the occurrence of patterns every day, and if the pattern does appear, the orders are placed (and executed). Since then, you have entered the market and your portfolio became dynamic.
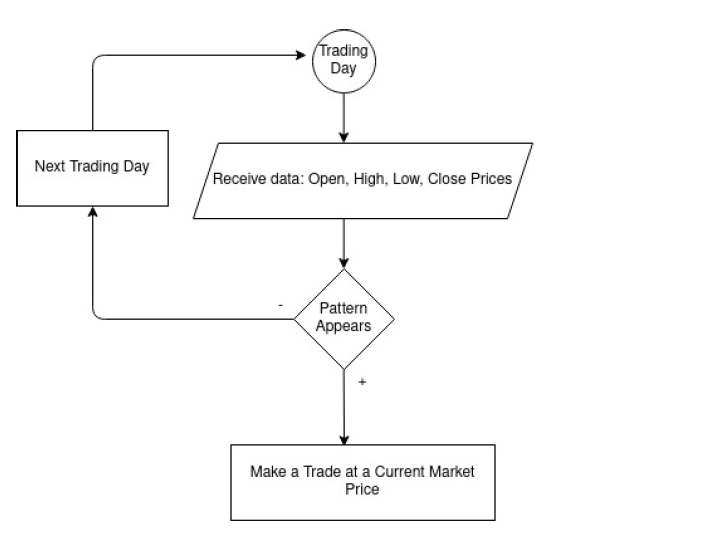
Opened trades are managed with two pending orders – stop loss and take profit. The price levels defined as entry price + stop loss for stop-loss order and entry price + profit target are checked every new trading day. The following chart shows examples of stop-loss and profit target price setup.
| Long Trade | Short Trade | |
| entry price | USD 100 | USD 100 |
| stop loss in % | 15% (*USD 100) = USD 15 | 15% (*USD 100) = USD 15 |
| stop loss in USD | USD 15 | USD 15 |
| stop-loss price level (same for both cases) | USD 100 – USD 15 = USD 85 | USD 100 + USD 15 = USD 115 |
| target profit in % | 15% (*USD 100) = USD 15 | 15% (*USD 100) = USD 15 |
| target profit in USD | USD 15 | USD 15 |
| target profit price level (same for both cases) | USD 100 + USD 15 = USD 115 | USD 100 – USD 15 = USD 85 |
Because Pattern Lab’s user has an option of setting up the units for stop loss/profit target level, we have placed both variants (i.e. percentage * entry price and absolute distance from entry price in monetary unit).
Stop Loss Order as a Stop Order Type
The type of stop-loss order during backtesting is Stop. The following flowchart describes the backtester state machine in the sense of “what happens if.”
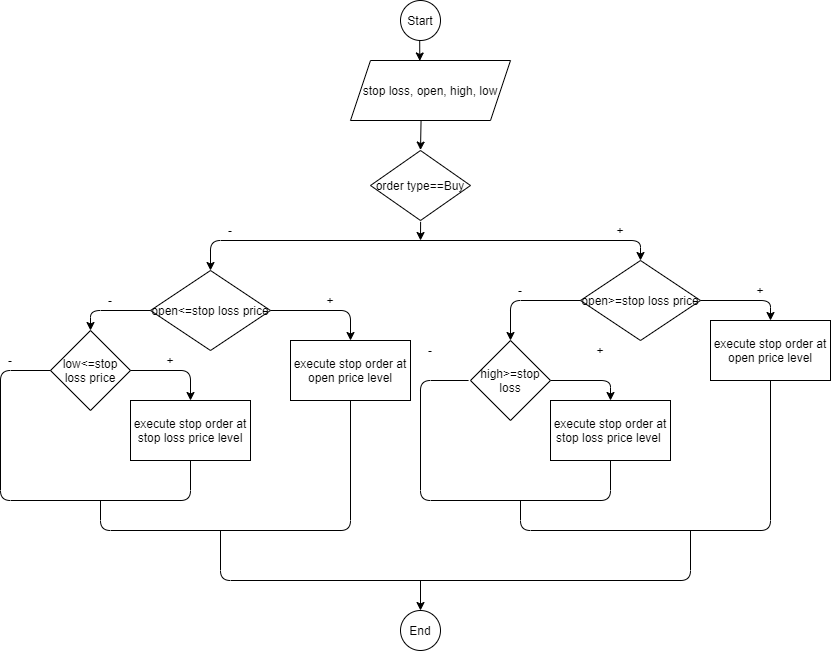
Having looked at the right side of the flowchart, we consider buy-side specific events. In the first step, the backtester checks the open price of a new candlestick bar. Comparing with the stop-loss price (aforementioned as an auxiliary price), the backtester either executes a stop order at an open price level (if the opening price is higher than stop-loss price, i.e. there is an opening gap on the market) or checks high price level with the stop-loss price level. If the high price is higher or equal to the stop-loss price, there is a stop order at the stop-loss price level execution.
The situation is mirrored for the sell-side.
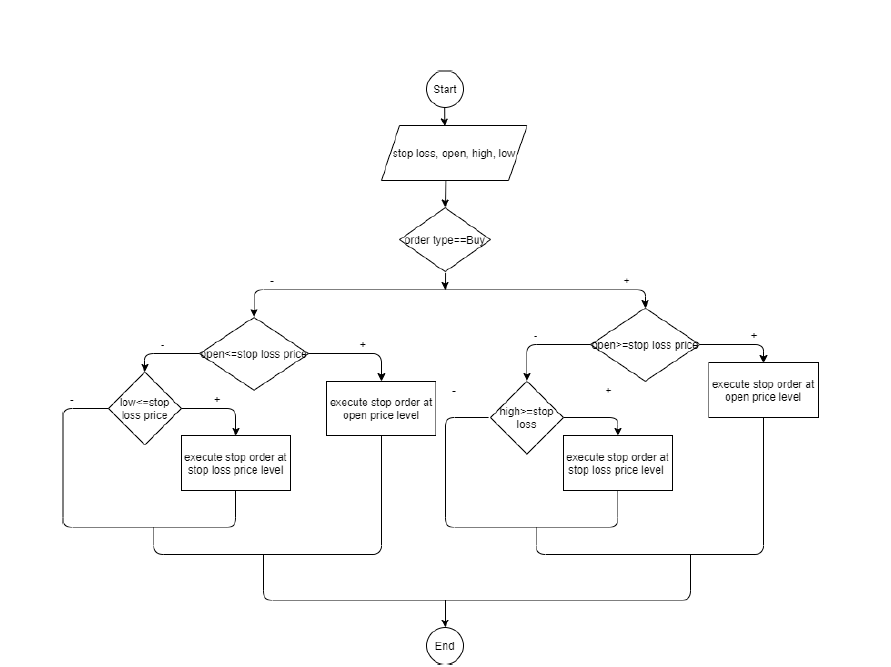
Reminding the fact the fast backtest uses only daily data we replace specific execution cases with others otherwise our results would show huge gaps among the specific trades and the performance results would be unrealistic. The following flowchart shows simplified logic for a Stop order.
The crucial simplifications are dedicated to the “gap” situation on both sides. Execution of the stop order is considered by stop-loss price level instead of the original open price level.
Take Profit Order as a Limit Order Type
Analogically, we can describe the take profit order, which is a limit order by definition. A decision-making scheme is illustrated in the following chart.
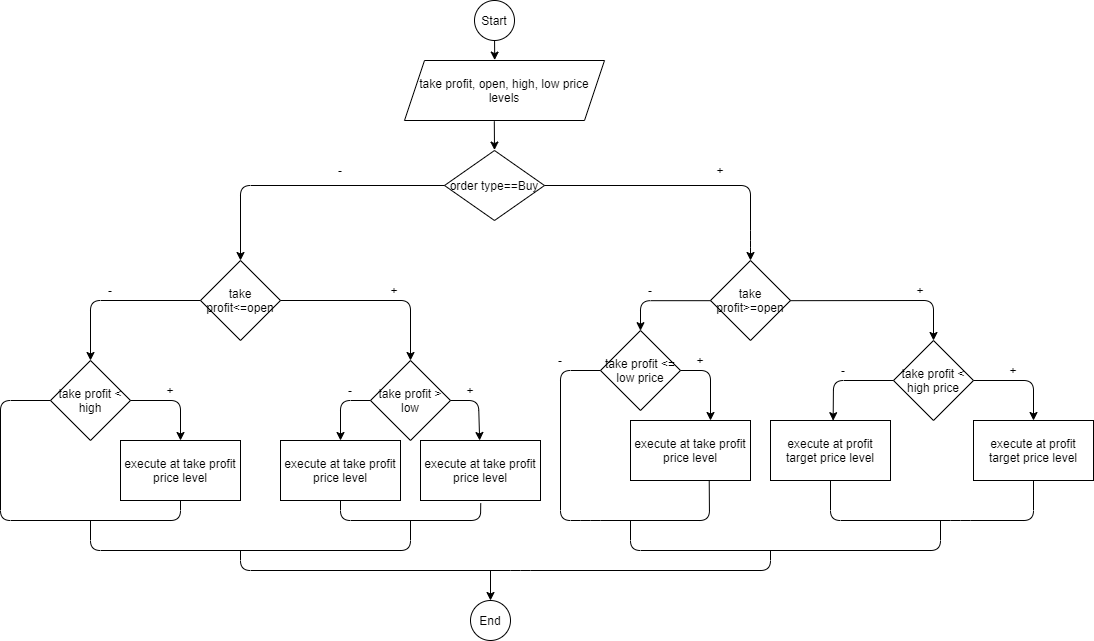
Again, considering the buy-side of the flowchart, the backtester asks whether the take-profit price level is higher than an opening price level of a new candlestick bar. If it is true then in the next steps the backtester checks whether the take profit price level is lower than a high price level of an incoming candlestick bar. If so, it executes at the profit target price level. If not, it signals a huge market gap and the execution is possible for the highest price of the day. On the other hand, if the take profit level is not higher than an opening price, the backtester checks in the next step whether the take profit price level is lower than the low price level. If it is lower, then it signals a regular situation during a peaceful trading day and it executes at the take profit price level. If the take profit price level is not lower than the day’s lowest price, then nothing happens, and your take profit order is not executed. The situation on the sell-side is mirroring the buy-side.
As in the previous step, we replace specific executions with simpler ones.
Instead of executing at a high price level in the case the market gap occurs, we make a trade at a profit target price level. The replacement can be justified by using daily data, which might indicate false market gaps (or could make an impression that the market gap occurs even if it does not).
The Main Takeaway
Finally, it should be mentioned that the above simplification leads to approximate results which quickly assess the basic strategy in a reasonable time. Otherwise, the results would suffer from unrealistic gaps brought by sparse daily data.
Sign up and try the Pattern Lab application.