Standard Deviation – Configuration of Investment Strategies

Standard Deviation – Configuration of Investment Strategies
Welcome to the next blog post of our ‘Configuration of Investment Strategies’ series. In this edition, we shift our focus to a pivotal metric in the world of finance — Our Standard Deviation Table. Understanding Standard Deviation is essential for investors aiming to gauge and manage the risk associated with their investment portfolios.
What is Standard Deviation?
Standard Deviation is a statistical measure that quantifies the amount of variation or dispersion in a set of values. In the context of investment, it serves as a crucial indicator of the volatility and risk inherent in a particular strategy or asset. A higher SD implies greater volatility, while a lower standard deviation suggests relative stability.
Interpreting Standard Deviation: Expressed as a percentage, SD provides insights into the degree of fluctuation in investment returns. A lower standard deviation is generally associated with a more predictable and less risky investment, while a higher SD signifies greater unpredictability.
Using Strategies Configurator
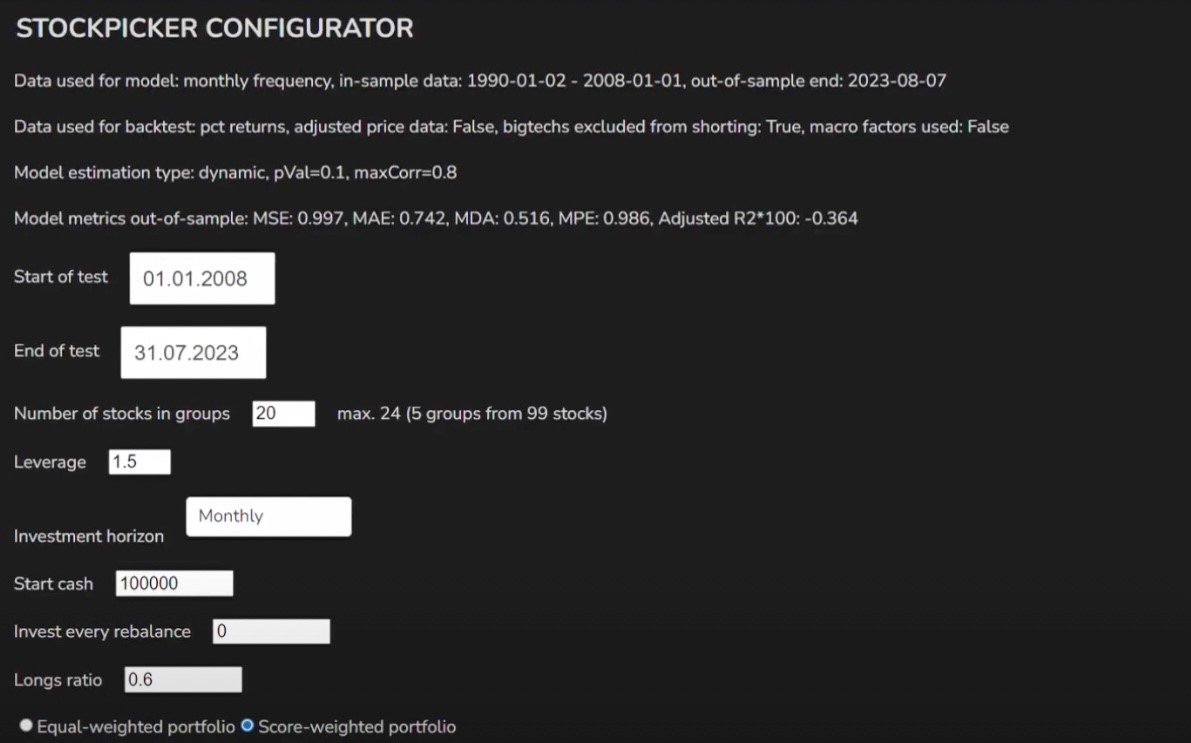
Different settings would lead to different performances in the standard deviation table. For our sample test, we used the following settings in our backtesting/ strategies configuration.
Strategic Insights
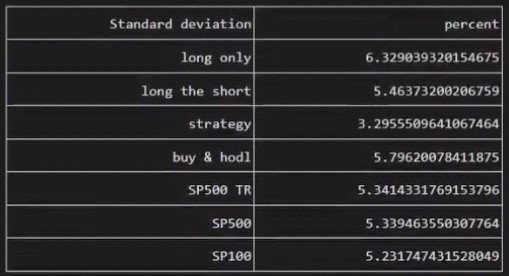
- Long Only: 6.3% – The Long Only strategy, tailored for risk-tolerant investors, exhibits an SD of 6.3%. This indicates a moderate level of volatility, making it suitable for those comfortable with a certain degree of risk that will get also great returns with a slightly high volatility.
- Long the Short: 5.4% – A hypothetical strategy shorting the most overvalued stocks, the Long the Short strategy boasts an SD of 5.4%.
- Strategy (Long and Short): 3.3% – The comprehensive Long and Short strategy, incorporating both long and short positions, stands out with a low standard deviation of 3.3%. This indicates a strategy that not only outperforms but does so with minimal volatility, appealing to investors seeking stability.
Invest in the forces that move stock prices
Leverage the power of factor investing with revolutionary software
Benchmarking
- Buy & Hold: 5.8% – The traditional Buy & Hold strategy demonstrates a standard deviation of 5.8%. This consists of holding the current SP&100 stocks for the benchmark period.
- S&P 500 TR: 5.3% – The S&P 500 Total Return index, accounting for dividend reinvestments, reports a SD of 5.3%.
- S&P 500: 5.3% – The S&P 500 index exhibits an SD of 5.3%, reflecting the risk inherent in a market-focused strategy.
- S&P 100: 5.2% – Similarly, the S&P 100 index, fundamental to stock selection, displays an SD of 5.2%. Outperforming these benchmarks in risk management underscores the efficacy of the strategies in discerning stocks with lower volatility.
Was the articles useful for you? Contact us and use Strategies Configurator for building and evaluating your investment strategies. If you want more info about how we use the rating of the stocks to create the different strategies read about it here.