Rolling Window Performance – Configuration of Investment Strategies

Rolling Window Performance – Configuration of Investment Strategies
In this part of our ‘Configuration of Investment Strategies’ series, we talk about ‘Rolling Window Performance,’ a crucial way to see how our strategies do in changing markets. This metric is important for comprehending how strategies perform within dynamic market conditions. But what exactly is a rolling window?
The Rolling Window Method
The rolling window method involves analyzing data within sequential subsets, progressing through a defined timeframe.
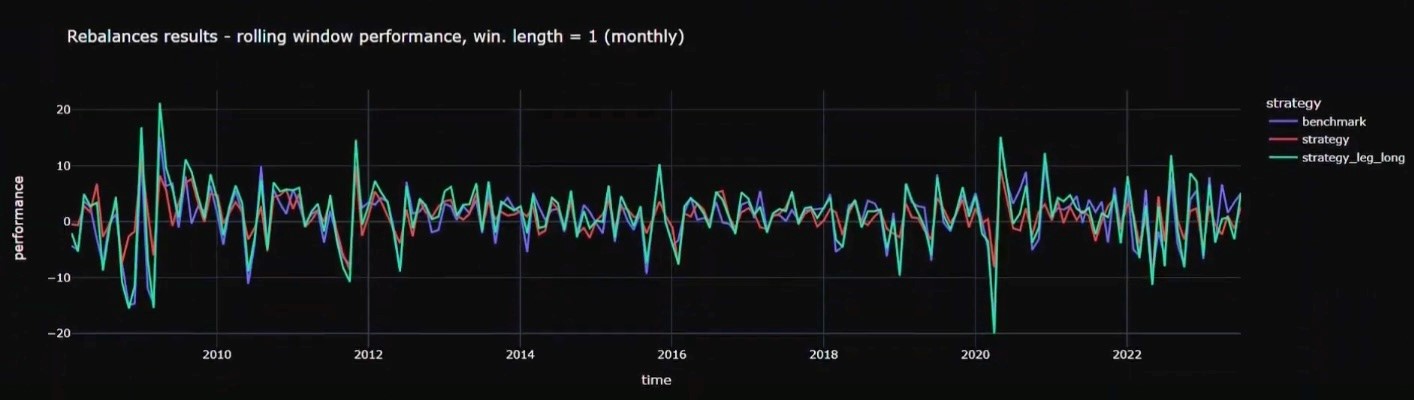
In our analysis, we employed a one-month rolling window, adaptable to specific evaluation needs. Each point on the graph represents the performance of a strategy for that given month.
This aids investors in grasping not only the broader trends but also in understanding how each strategy fares in shorter time frames.
The mean of a probability distribution, also known as the expected value or average, is a measure of the central tendency of the distribution. It tells us the long-term average or the “typical outcome” when a random experiment is repeated many times.
Invest in the forces that move stock prices
Leverage the power of factor investing with revolutionary software
A sample demonstration
We can now focus on how each strategy performed. Focusing on the Long Strategy also referred to as the ‘Aggressive Strategy’, the rolling window performance yields important insights. This strategy notably demonstrates higher performance peaks in both positive and negative scenarios, showcasing its potential for generating superior returns while also revealing increased volatility.
Shifting attention to our next strategy, the Long-Short strategy (Red Line), the rolling window performance reveals great returns alongside managed volatility. Particularly, it mitigates negative peaks, illustrating the strategy’s ability to balance high returns with controlled volatility. By clicking on the respective labels on the right side, one can deactivate overlapping lines for better visualization. This balance between high return and controlled volatility is important to investors who are looking for significant returns coupled with risk management.
But how do these strategies compare against a benchmark? We’ll evaluate them against our chosen benchmark, the S&P 100, from which we select our stocks.
- As discussed before, the Aggressive and Long-Short one observes that Aggressive Strategy delivers higher returns and generally higher volatility compared to the benchmark and is suited for someone who wants to beat the market and is risk tolerant.
- On the other hand, the Long-Short strategy exhibits slightly increased positive peaks and moderately reduced negative peaks, signifying its capacity to mitigate risk and volatility while still delivering better results than the benchmark.
If you want more info about how we use the rating of the stocks to create the different strategies read about it here.
Was the articles useful for you? Contact us and use Strategies Configurator for building and evaluating your investment strategies.