What Is Behind One Stock Characteristic?
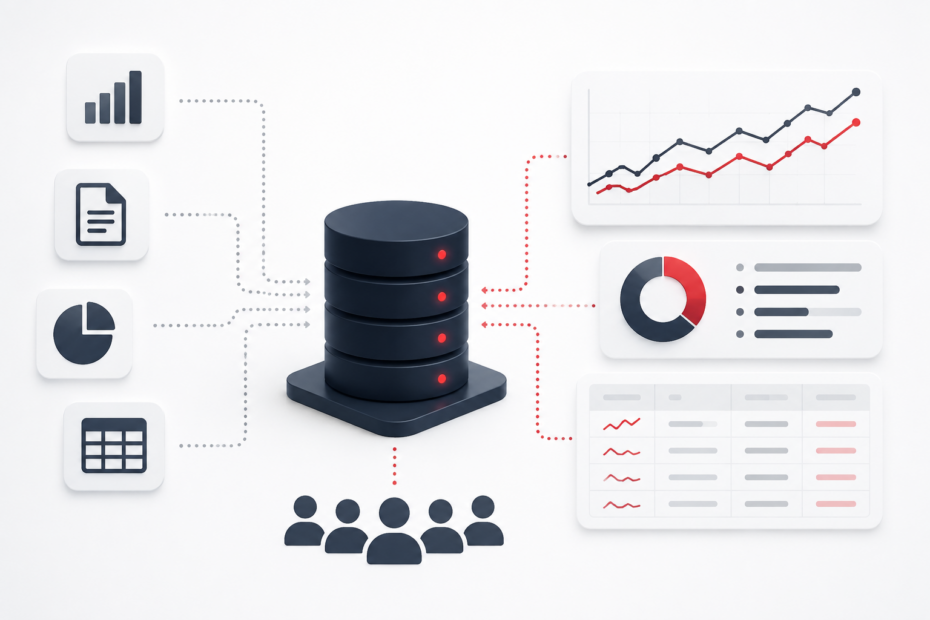
Discover what stands behind 400+ Stock Characteristics, 30,000 monthly portfolio calculations, and the data infrastructure powering AP.
Discover what stands behind 400+ Stock Characteristics, 30,000 monthly portfolio calculations, and the data infrastructure powering AP.

At Analytical Platform, we continuously refine our methodology and research infrastructure to ensure that our factor models are built on the highest-quality data possible. In June 2026, we introduced a major upgrade to how we process, store, and calculate characteristics… Read More »Methodology Upgrade: Improving Data Quality and Factor Calculations
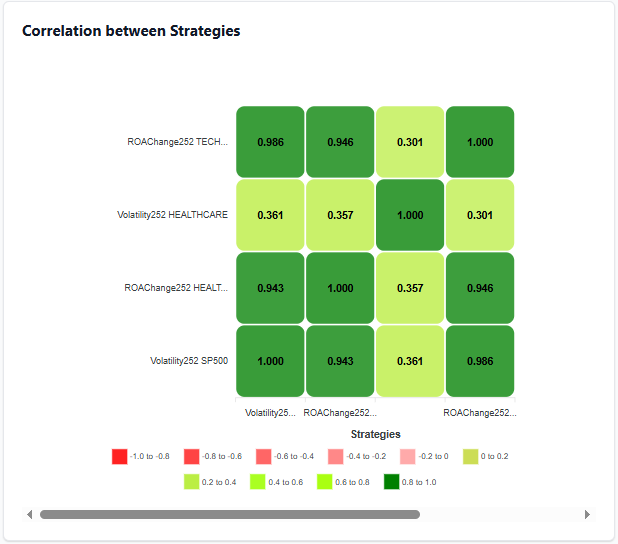
Factor signals overlap, correlate, and sometimes capture very similar underlying behavior despite being built differently.

March delivered one of the clearest examples of factor performance rotation we’ve seen in a while. February performance was a negative predictor of March performance. In other words, what worked best in February was systematically punished just one month later.… Read More »When Last Month’s Winners Stop Working
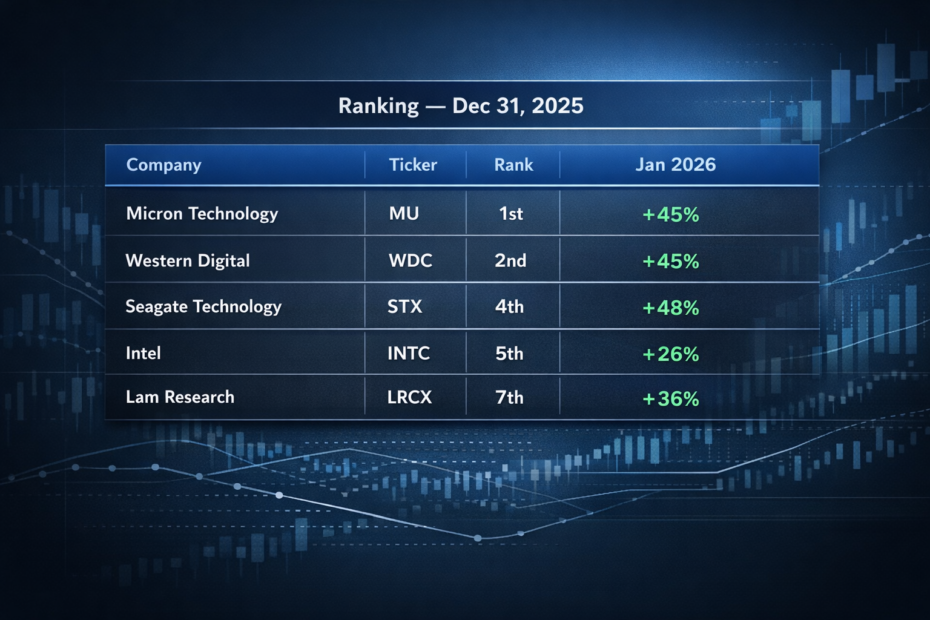
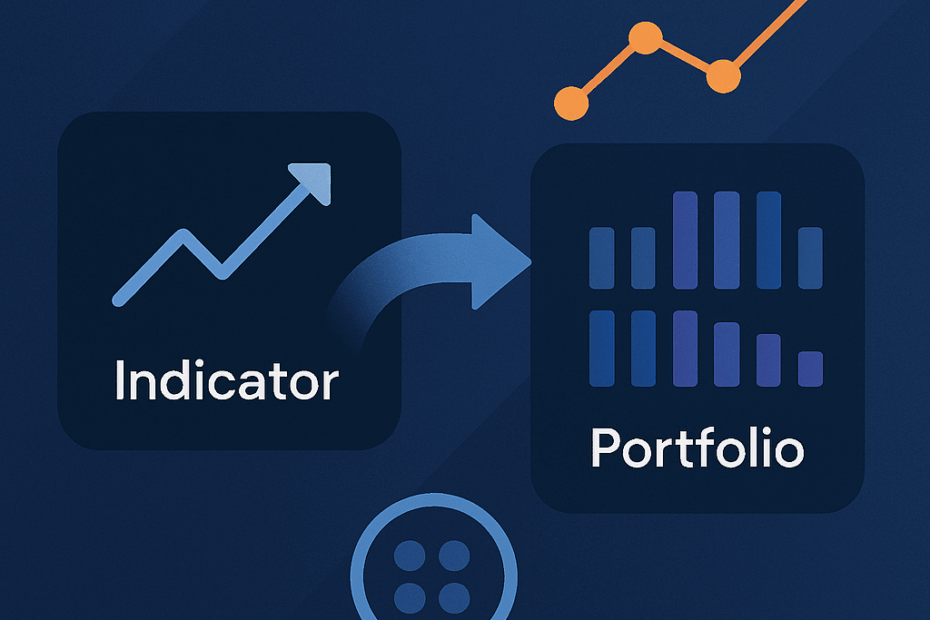
Before the move, the top-performing stocks were ranked at the very top of the PLUS DI 252 indicator across the S&P 500 universe.
With the start of the new year, we are proud to officially introduce Analytical Platform 2.0, the latest evolution of our investment analytics platform designed for data-driven investors, analysts, and portfolio managers.

The end of 2025 is the ideal time to look at what really worked on the market—and, more importantly, why, as the interpretation of individual metrics can be very misleading.
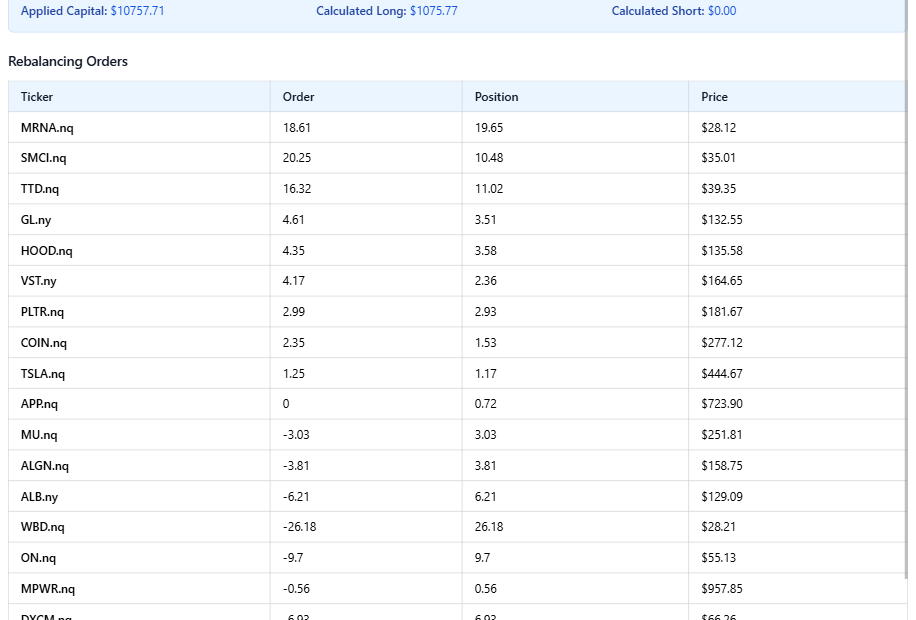
This document explains how the AP’s Rebalancing App works. It is designed for semi-automatic portfolio adjustments based on AP strategies.
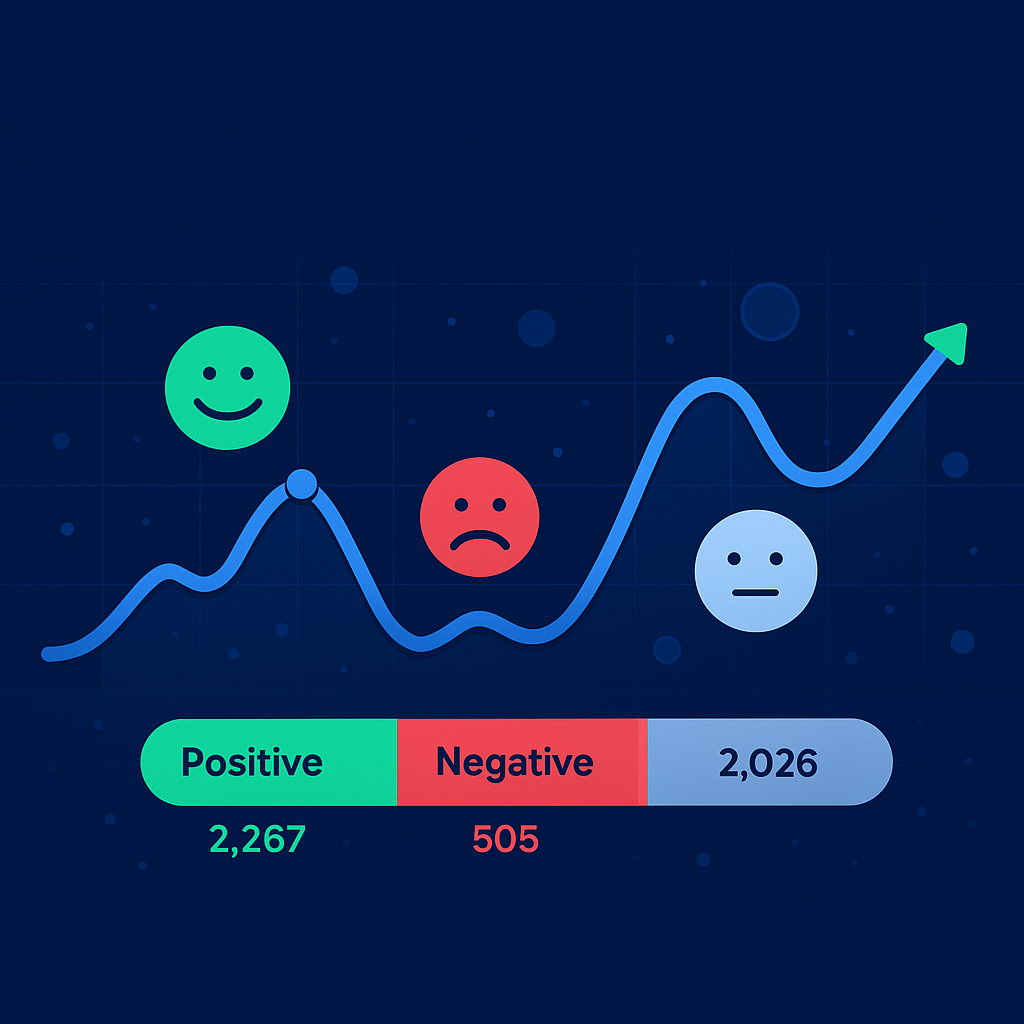
The document describes how we collect articles about financial markets published by online media and how we analyze them.
This documentation explains how the application works, how strategies are structured, and how individual screens interact.