In the previous newsletter, we showed how quickly factor leadership can rotate. What worked in February was heavily punished in March. This month, we focused on something different.
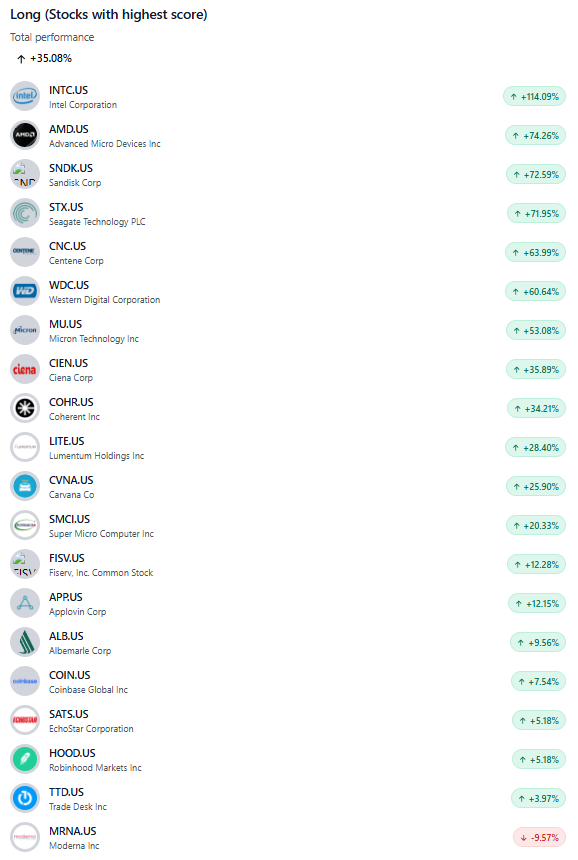
Several 20-stock portfolios built from stock characteristics returned more than 30% in April.
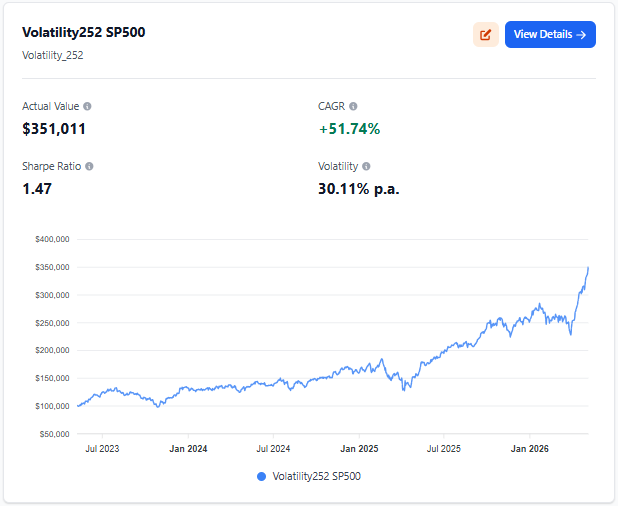
On the right, you can see, for example, how the Volatility (252d) factor performed on the S&P 500 universe during April.
And these were not concentrated bets on a few speculative names.
- equal-weight portfolios
- constructed systematically
- across the broad S&P 500 universe
That’s what made the result interesting. At first glance, many of those portfolios looked very similar:
- semiconductors
- AI infrastructure
- storage, and datacenter companies
But those themes were not part of the selection process.
The portfolios were generated systematically through stock characteristics.
And this is where things become interesting.
Different Characteristics, Similar Portfolios
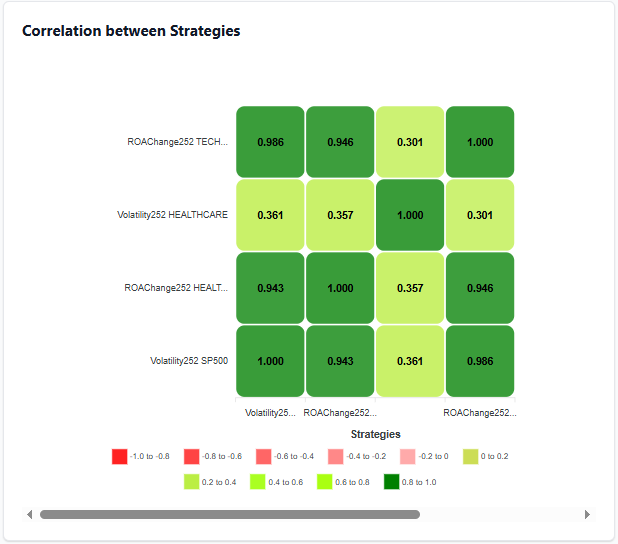
Different characteristics often lead to very similar portfolios. Why? Because stock characteristics rarely exist independently. Signals overlap, correlate, and sometimes capture very similar underlying behavior despite being built differently.
That’s why we use correlation matrices inside the Analytical Platform. For example, Volatility (252d) on the S&P 500 and ROA Change (252d) in the Technology sector showed very similar behavior over the last three years.
At the same time, Volatility (252d) in Healthcare behaved very differently from Volatility (252d) across the broad S&P 500 universe.
Same characteristic.
Different environment.
Different behavior.
Markets Are More Structured Than They Appear
Markets are often far more structured than they initially appear. And sometimes, what looks like a thematic market story is simply the surface layer of deeper statistical relationships.
The new May characteristics are now available inside the Analytical Platform. Explore:
- top-performing signals
- factor correlations
- cross-sectional behavior
- and the stocks behind them
Because once you look beyond outcomes, markets start becoming much more interpretable.