A new era of Stockpicking & building investment strategies

A new era of Stockpicking & building investment strategies
The current approach to investment strategies building
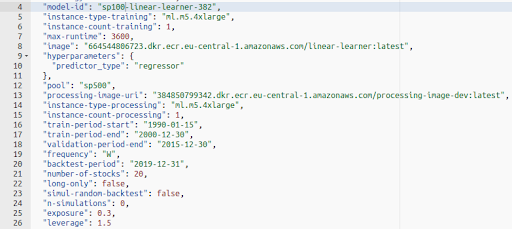
Since June 2020 we have been running our AP US Large-Cap Hedged 1.5X Shares strategy based on linear stockpicking model.
The strategy uses a model that is retrained once a month, selects the most critical features, and assigns them the weights. Essential features are the same for all the stocks from the basket. The values of features are calculated for each stock and then weighted to get the final score of the stock. As a result, stocks are sorted from the relatively most undervalued to the most overvalued stock.
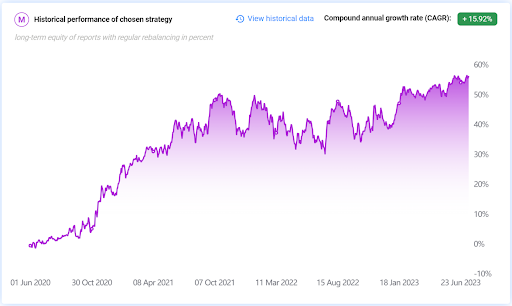
20 most undervalued stocks have been bought, and 20 most overvalued stocks have been sold; used leverage is 1.5 while using fractional shares. The targeted CAGR is 13.75 %, and the maximal drawdown was -17.10 % in the back-tested period from 2008 to 2020. We are really happy that the back-tested results were over-performed by the real results in the live 3+ years of trading, as shown in the picture below.
A new approach to investment strategies building
From August 2023, we have started using a new model that is still linear but accompanied by a new style of output representation. Reasoning takes into account not only direct weight but also indirect impact on other features.
It is super-important for deploying non-linear models which will be used in the coming months and where the previous manner isn’t applicable.
Since we have been observing the needs of our clients, we are going to push in the production new strategy which aims to bring:
- Low drawdowns
- Short drawdown periods
- Maximal CAGR
You can see the preliminary back-tested financial indicators we use for the model development below. It is presented in the raw table. The whole new application with a suitable front-end will be released in the Analytical Platform in the upcoming months.
Results interpretation
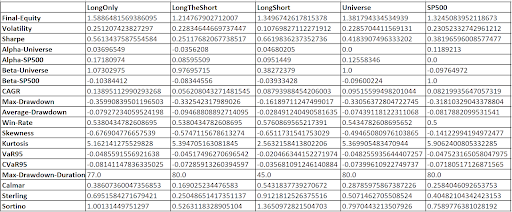
The table shows the values of financial indicators for the LongOnly strategy, which holds the 20 most undervalued stocks in the portfolio; LongTheShort, a hypothetical strategy used to demonstrate the performance of the most overvalued stocks, “strategy” holds the 20 most overvalued stocks in the portfolio; LongShort, a strategy with the parameters of the AP US Large-Cap Hedged 1.5X Shares strategy; Universe, which in our case is the S&P 100 index; and the results of the S&P 500 index during the period under review. The results are displayed for the backtest period from 12/31/2019.
Below you can see a verbal description of the evaluation of the Backtested Model/Strategy Results table that was created using ChatGPT.
LongOnly Strategy has the highest Final Equity, which indicates that this strategy ended with the highest value. However, it also shows the highest volatility and the largest maximum drawdown, which implies that this strategy can be quite risky. It also had the longest maximum drawdown duration, showing that the investment took the longest time to recover from a loss. The Sharpe ratio for this strategy, while not the highest, indicates a decent risk-adjusted return. This strategy also demonstrated a relatively high win rate.
LongTheShort Strategy underperformed in terms of Final Equity, CAGR (Compound Annual Growth Rate), and risk-adjusted measures such as Sharpe, Calmar, Sterling, and Sortino ratios when compared to the other strategies. Its Alpha with respect to the Universe and S&P500 is also lower, indicating that this strategy isn’t generating sufficient excess returns considering the risks taken. However, it has slightly less volatility and maximum drawdown than the LongOnly and Universe strategies.
LongShort Strategy appears to be the best risk-adjusted strategy. Despite having lower Final Equity than the LongOnly and Universe strategies, it has the lowest volatility, maximum drawdown, Average drawdown, and shortest maximum drawdown duration. Its risk-adjusted performance is the highest among all strategies, indicated by the highest Sharpe, Calmar, Sterling, and Sortino ratios. The LongShort strategy also shows the highest Alpha with respect to the Universe, suggesting a strong performance over the benchmark. Additionally, it has the highest win rate among all strategies.
Universe Strategy falls in the middle of the strategies in terms of risk and return characteristics. It has a reasonable final equity and a fairly average performance with respect to other measures like volatility, maximum drawdown, and risk-adjusted metrics (Sharpe, Calmar, Sterling, and Sortino ratios). However, it has the second-highest maximum drawdown duration, suggesting that it might take significant time to recover from losses.
The S&P500 Strategy, used as a benchmark here, has a reasonable final equity and win rate, with risk metrics in the middle of the range, yet it underperforms the LongOnly and LongShort strategies in terms of final equity, risk-adjusted return ratios, and win rate.
Overall, if you are seeking a strategy with the best risk-adjusted returns, the LongShort strategy appears to be the most suitable. It offers a strong balance of high returns and risk control, as evidenced by its superior Sharpe, Calmar, Sterling, and Sortino ratios. On the other hand, if you are interested in the strategy that has produced the highest total return (ignoring risk), then the LongOnly strategy would be preferable.
Performance improvement
The attentive reader will surely notice that the results of the presented model are worse than those of the model used so far.
For example, the CAGR is about 9% versus 13.75%. In the next articles, we will therefore show how the model can be further adjusted/”tuned“. For example, through a different objective function, a limited* selection of factors, etc.
Score decomposition
Let’s look at the main difference between the old and new approaches. It is the explanation of the important features being used in the predictions.
First of all, it is important to understand how the creation of predictions works.
- The development of the model
- Creation of predictions in defined periods (monthly, weekly, etc.)
- Explanation of the importance of each feature for each stock
First, a few words about training the model and selecting important features. To facilitate the convergence process during model training, we perform a preselection of factors, thereby reducing the dimensionality of the training data.
We perform preselection based on the level of correlation between individual factors and pick those factors with the greatest predictive power. For example, for the S&P100 index, at a threshold value of the correlation coefficient of 0.4, out of 1269 factors, “only” 79* of them will remain. The procedure ensures that undesirable effects such as multicollinearity disappear from the training set, the volume of data is reduced, and the outputs from the trained model are easier to interpret. At the same time, the loss of information contained in the training data is minimized.
The third mentioned point is a bit unintuitive. There is a great guide that will help you to understand this machine-learning technique an example of artificial driving. In the field of investments, we operate the same.
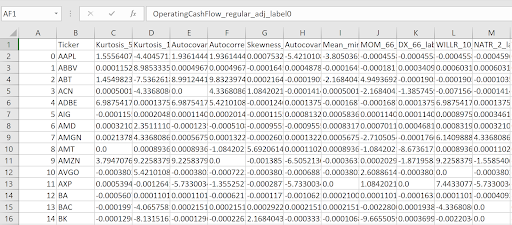
In the rows, you can see the evaluated stocks. In the columns, some features were selected by the model as the most important.
So that the table shows:
- What is the impact of the selected feature on each stock
- Which features have the biggest positive (+)/negative (-) impact on the prediction for every single stock
An example is better than a thousand words, so let’s have a look at the particular feature/stock.
It can be seen from the (source) table that the factor SalesPerShare_regular_adj_Position_252 has the greatest positive impact on the prediction of the MO share (0.0359). On the contrary, the impact on the prediction for the most undervalued company INTC is two orders of magnitude smaller (0.0001).
The factors apExAssets_reported_calc, OperatingCashFlow_regular_adj, OperatingMargin_reported_calc, and CapEx_reported_Change_126 have the largest positive impact on INTC prediction (0.0021).
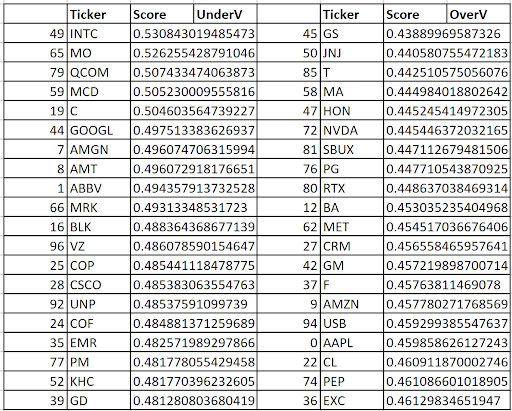
In this way, we can decompose the created prediction, i.e. the order of individual stocks. The table shows the prediction of the given model based on data from 07/21/2023 valid for the next week.
The indirect impact of the feature on other features
Indirect impact is another abstract matter which is needed to be understood. Let’s look at it by the aggregation of the importance of the features.
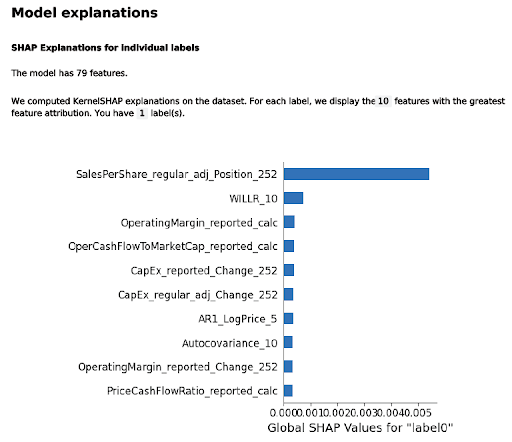
As you can see in the picture, the model selected 79 features to evaluate the stocks. The highest direct and indirect (all together) impact on the prediction has Sales per share adjusted Position in 252 days.
- It means that this factor has the most significant aggregate effect. However, this does not mean that it has the most significant effect on all stocks from the considered pool, as we showed above using the example of the INTC share.
- At the same time, the direct impact of the factor on the prediction is low, but overall the impact through a large influence on other factors is the largest.
The columns in the Score decomposition image are the same as the rows in the Aggregated impact to the prediction image. The sum of the row values is not equal to the score in the prediction; it is purely an explanation of the significance of the impact of the indicator on the current prediction.
Call to action
We know that the explanation and understanding of both intended and realized trades are crucial. Since we have been working on the front-end and descriptions of our predictions as friendly as possible, we would kindly ask all of our bellowed clients, copiers, and supporters for a short discussion to help us better understand your needs.
The main questions are:
- Do you understand how the indirect impact works?
- Would you appreciate deeper decomposition saying how the indicator influences other indicators, what is the direct impact, or is it redundant for your daily usage?
- What would you appreciate showing in graphs on the front-end? For instance, what are the main changes in the features’ importance for the selected stock between two rebalances?
- Every possible idea coming to your mind is connected with this new approach.
Thank you, keep in touch and change the world of investment together.
Jiří Fuchs, co-founder of Analytical Platform