Investors and financial analysts are already used to employing this indicator when assessing stocks or investment funds. However, the current newsletter looks at how R-squared (R2) can be utilized in factor investing to build a portfolio based on investment indicators.
R-squared in traditional financial engineering
R-squared is a way of showing how well a regression model’s independent variable accounts for the changes in the dependent variable. If the R-squared is 100%, it means the independent variable perfectly predicts or explains every change in the dependent variable, such as a stock’s movement matching exactly with an index.
For a basic understanding of R2, we can use a quote from Investopedia. „In investing, a high R-squared, from 85% to 100%, indicates that the stock’s or fund’s performance moves relatively in line with the index. A fund with a low R-squared, at 70% or less, indicates that the fund does not generally follow the movements of the index. A higher R-squared value will indicate a more useful beta figure. For example, if a stock or fund has an R-squared value of close to 100%, but has a beta below 1, it is most likely offering higher risk-adjusted returns.“
R2 from the perspective of factor investing
Factor investing is based on the idea that certain characteristics (factors) of securities systematically affect their returns and risks. Therefore, investors do not bet on individual stocks, but on factors that have historically delivered above-average returns.
Factors are, in fact, investment indicators, and their usefulness is commonly estimated by the difference in returns between the highest and lowest quantile. However, finding a reliable factor in this way does not guarantee that its subsequent use for real portfolio construction will deliver the expected results. The theoretical approach needs to be transferred to investment practice. Let’s see how to do it.
Factor investing methodology vs real portfolio construction
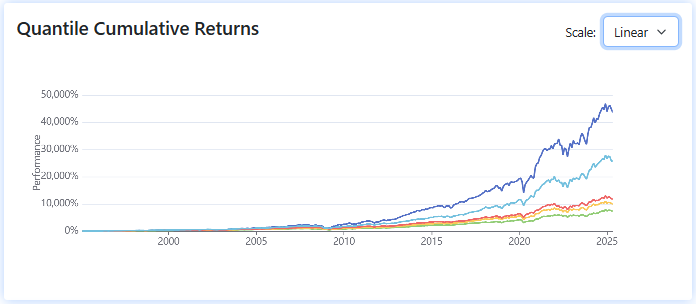
- Following industry standards, our Analytical Platform application facilitates the assessment of factors based on the difference between the performance of quantiles.
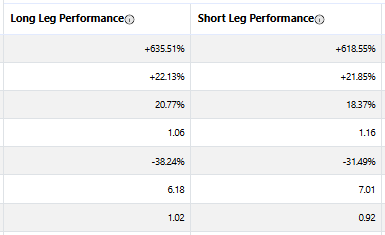
For example, for the Return on Investment (ROE) indicator considered within the S&P 500 index, we assess the price movement of the 100 stocks with the largest ROE (Quantile Q5) and subtract the movement of the stocks with the smallest ROE (Q1), thus performing the so-called Long-Short approach. This results in understanding from which quantile stocks grow the fastest, what the difference is in the performance of stocks with opposite indicator values, and how statistically significant the indicator is. - However, in the live portfolio construction, we usually do not invest in the entire quantile (100 stocks). Therefore, when we backtest portfolios with fewer stocks in the next step, we may get different results compared to the assumptions obtained in the previous step. Here we get to the point of the article. R2 can help us to understand how much the smaller/real portfolio (in our case, Long/Short 20/20) matches the characteristics of the larger portfolio (Long/Short 100/100) on which the factor is being evaluated in the first step.
Assessment of a specific indicator
| Indicator | R2 | Beta | Corr | TrackError | MSE | IR_diff |
| Return on Equity | 0.083326 | 0.399334 | 0.288663 | 0.037189 | 0.001382 | -0.048641 |
The results display a low R-squared value, so we find that the ROE-based portfolio of 20/20 stocks only minimally explains the behavior of a portfolio of 100/100 stocks.
In the specific case of the ROE indicator, the 100 lowest-ranked stocks significantly outperform the 100 highest-ranked stocks over the long term. However, the 20 lowest-ranked stocks perform very similarly to the 20 highest-ranked ones. This situation should not arise for factors with high R-squared, where performance will correspond better with the factor estimates. An example of such an indicator is the T-statistic factor.
Conclusion
In factor investing, R-squared helps us to construct an investable portfolio. Given a factor that looks good at first glance, R2 will immediately help us to see whether the investment portfolio will show similar characteristics.
Using R2, we bridge the gap between the factor approach, where broad quintiles of hundreds of stocks are considered, and the portfolio we actually invest in, which typically contains fewer stocks.
Register today & enjoy one month
FREE trial of our application