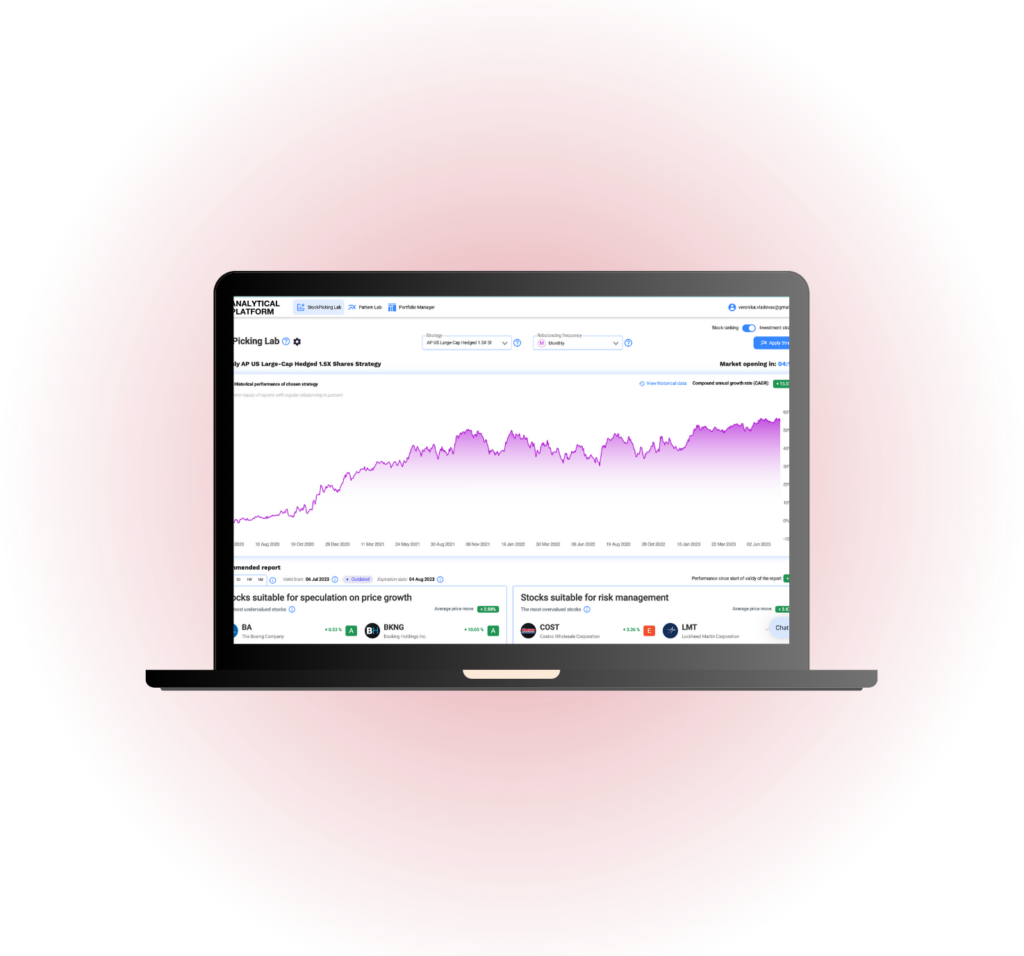
We analyze investment indicators and show you stocks with the best and worst values. Rely on data, statistics, and proven investment indicators to build your stock portfolio. Analytical Platform brings a quant approach to managing your investments.
Total Assets Change – value indicator
Total Assets Change factor represents the variation in a company’s total assets over a given period. This measure can be used to understand the company’s growth pattern and financial health. It provides a clear view of the company’s expansion rate in terms of asset accumulation, useful in evaluating its value. With this metric, investors can make an informed decision, considering the company’s capability to generate a return on its assets.
Statistical significance of the indicator
- Signal strength (T-test): 5.6056 (✓)
- Statistical confidence (P-value): 100.0000 % (✓)
- Signal direction: Descending (↘)
The indicator is statistically significant and shows a high strength of decreasing signal in the long run. In other words, stocks with the highest score underperform those with the lowest score.
Stocks with the highest and lowest values
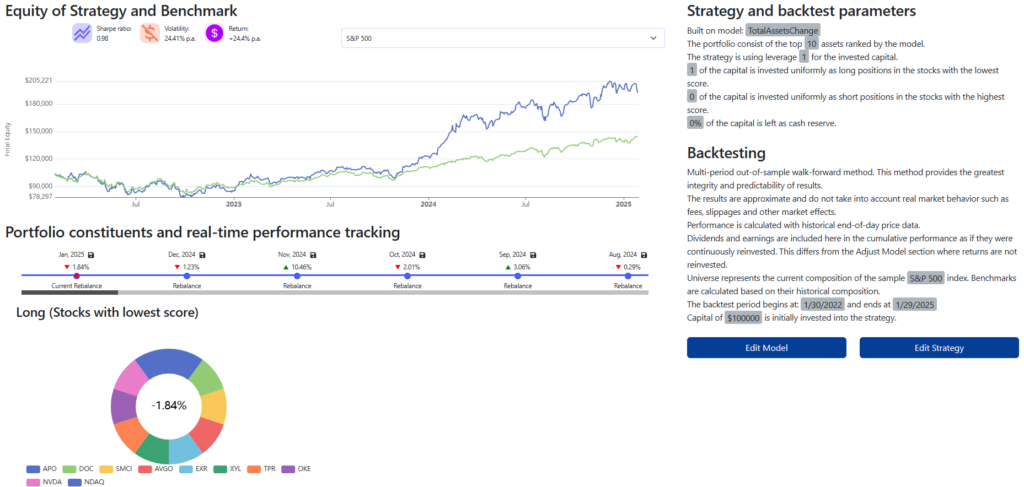
- Stocks with the lowest score: APO, DOC, SMCI, AVGO, EXR.
- Stocks with the highest score: CME, MRNA, HAS, ICE, VRSK.
Factor-based investment portfolio
A portfolio built on an investment in the 10 stocks with the lowest indicator value has significantly outperformed its underlying benchmark over the past 3 years.
Investing according to indicators that matter
- We showcase indicators you can use to evaluate stocks and build portfolios. Learn more about our software.
- There are over 10,000 known indicators and new ones emerging every day. See analyses of other investment indicators.
- Statistics, Big Data, and Machine Learning allow us to find out whether indicators impact stock price movements or not.
- Try our application and make sure you’re picking stocks the right way!
Register today & enjoy one month
FREE trial of our application