March delivered one of the clearest examples of factor performance rotation we’ve seen in a while.
In other words, what worked best in February was systematically punished just one month later.
How we measure this
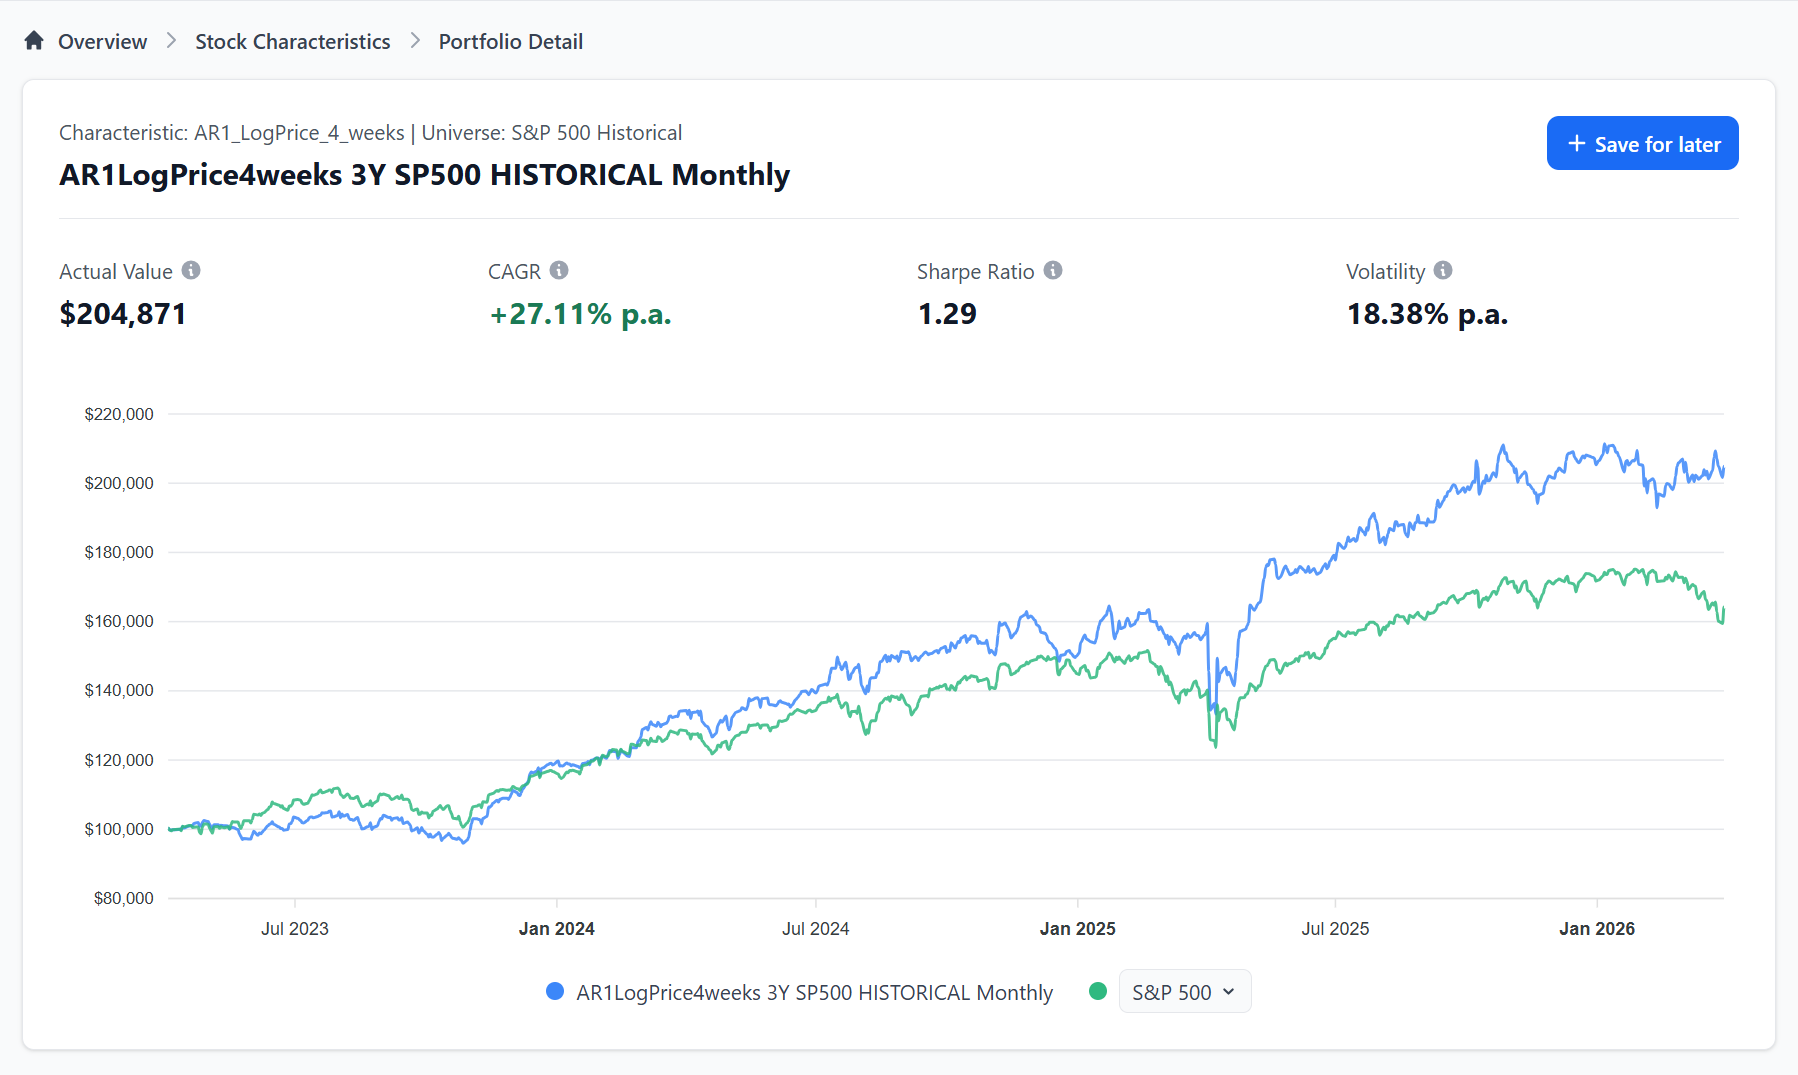
Our approach differs from traditional factor research. We don’t work with abstract long-short portfolios. Instead, for each factor, we select 20 stocks from the S&P 500 with the highest exposure and build a long-only portfolio. This means the results reflect not just a theoretical factor, but a real, investable basket of stocks.
February: when trend works
In February, price-based factors dominated — momentum, rate-of-change variants, and price positioning signals. It was a textbook month where following the trend paid off.
March: a sharp reversal
One month later, the picture changed dramatically. The same factors that led the market in February came under pressure.
This wasn’t about a single signal failing. The entire “price trend” cluster broke down.
What held up instead
Interestingly, the best-performing factors in March were those that were not particularly strong in February.
These didn’t generate positive returns — they simply lost much less.
Context: how large were the differences?
Even in a fully negative month, the gap between the best and worst characteristics was close to 10 percentage points.
What this looks like in practice
If you were holding a 20-stock portfolio, a “good” selection in March lost around 0.3%, while a “bad” one lost as much as 10%. That’s a massive difference in just one month.
What to take away
February rewarded trend. March punished it.
What next
This single month highlights something important: factor performance can shift very quickly. At the same time, this is a natural feature of factor investing — not a flaw.
What we saw in March is exactly that: rapid rotation, short-term drawdown, and a shift in leadership. However, short-term losses do not necessarily signal that a strategy has stopped working — they are often the price paid for long-term edge. Even consistently strong factors go through weaker periods, as illustrated by signals that perform well over time but still experience occasional drawdowns.
Explore how stock characteristics evolve over time
Situations like this make the most sense when viewed in a broader context. On Analytical Platform, you can go far beyond a simple 20-stock portfolio:
- test different portfolio sizes, from concentrated ideas to broader baskets
- apply leverage
- explore long/short or short-only strategies
- switch between universes such as STOXX 600, Technology, and others
Because once you understand how these factors behave across time, you can start building portfolios that are not just reactive to one month but designed to work across regimes.
The Edge Is Structural
Stop chasing last month’s winners.
Start understanding what drives the next ones.