At Analytical Platform, we specialize in building and operating investment strategies using quantitative tools such as backtesting. These methods let us evaluate how different factors perform and how they interact in multi-factor portfolios.
But for a long time, one crucial question remained: how much does survivorship bias distort our results? Now we have a clear answer — and it’s more significant than many investors might expect.
What is Survivorship Bias and Why Does it Matter
The concept of survivorship bias goes back to World War II. Analysts studying returning aircraft noticed where bullet holes were concentrated and suggested reinforcing those areas. A mathematician, Abraham Wald, pointed out that the missing planes — the ones that didn’t return — likely had damage in different places. Focusing only on the survivors meant concluding an incomplete picture.
In finance, survivorship bias occurs when we test an investment strategy using only companies that still exist today, while ignoring those that went bankrupt, merged, or were removed from an index.
For example, if we backtest using only the current members of the S&P 500, we’re effectively assuming that all these companies have always been there — that none ever failed or were replaced. In reality, the S&P 500 has seen hundreds of changes over time, with underperforming firms regularly removed and new leaders added.
The Initial, Barely Noticeable, Bias
To measure the survivorship effect, we ran two backtests comparing the results of the whole scope of the S&P 500 index.
- Using the current S&P 500 constituents (the “Universe”).
- Using the historical S&P 500 composition (the “Benchmark”), including firms that no longer exist in the index.
| Metrics | Universe, Biased (Current S&P 500 Index) | Benchmark, Unbiased (Historical S&P 500 Index) | Difference |
|---|---|---|---|
| Total Return (10Y) | 349.75% | 295.17% | -54.58% |
| Annual Return (CAGR) | 15.80% | 14.35% | -1.45% |
| Sharpe Ratio | 0.90 | 0.84 | -0.06 |
| Max Drawdown | 38.14% | 31.78% | -6.36% |
The takeaway? Over the ten years under review, the historical unbiased composition delivered slightly worse results across most metrics, except for the maximum drawdown. The effect is noticeable, but does not appear dramatic.
When Bias Turns Extreme
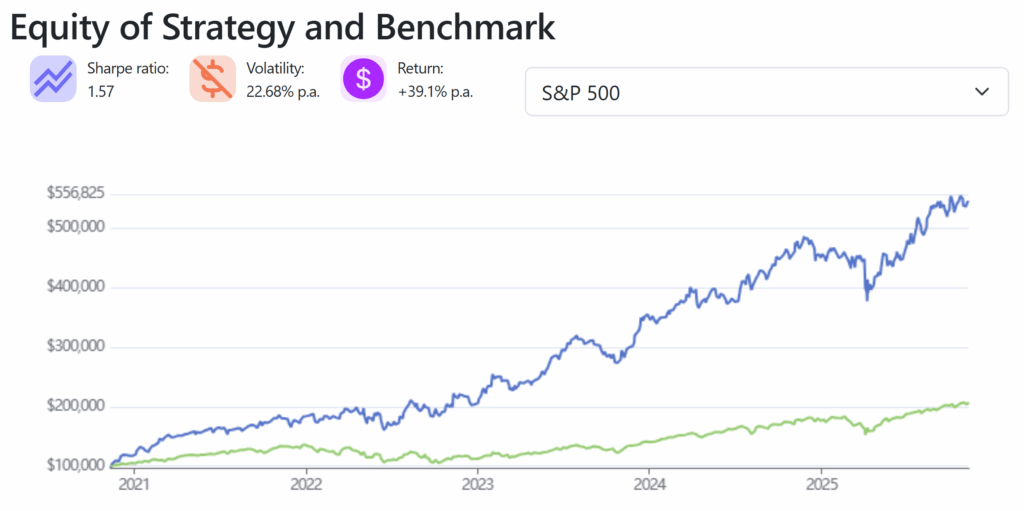
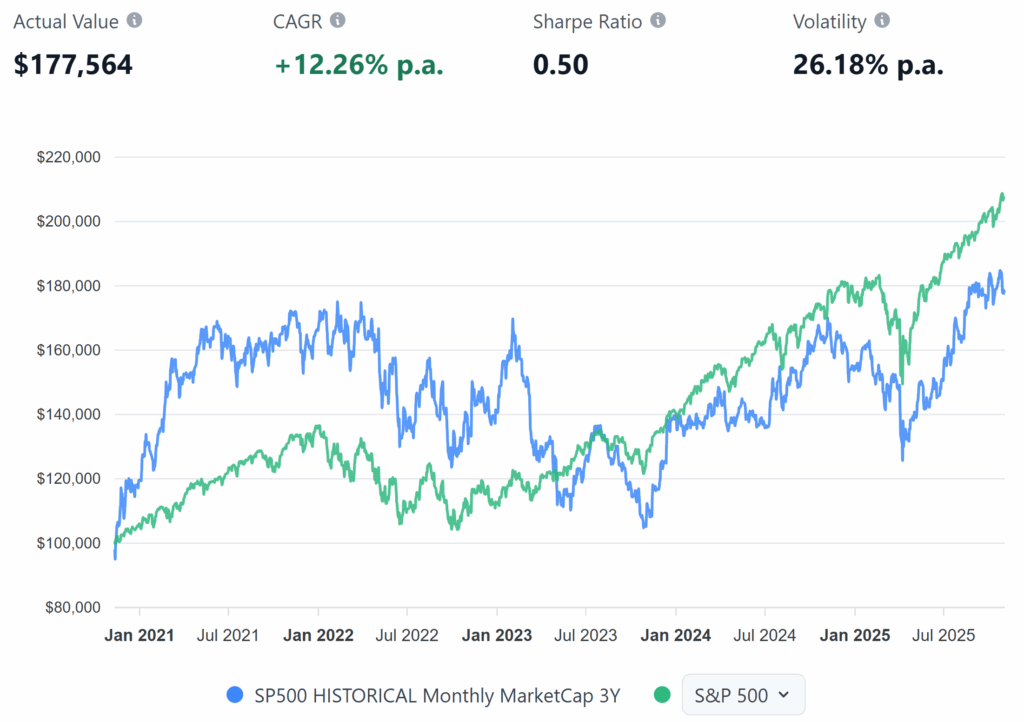
Let’s move on to the more exciting results. For this purpose, we tested a more volatile case: a portfolio of the 20 smallest companies in the S&P 500, 5 years, rebalanced monthly, comparing current (biased) composition with historical (unbiased).
| Metrics | 20 Stocks with the smallest MC (Current S&P 500 Index), Biased | 20 Stocks with the smallest MC (Historical S&P 500), Unbiased | Difference |
|---|---|---|---|
| Total Return (5Y) | 443.14% | 77.56% | -365.58% |
| Annual Return (CAGR) | 39.10% | 12.26% | -26.84% |
| Sharpe Ratio | 1.57 | 0.81 | -0.76 |
| Max Drawdown | 22.42% | 40.16% | +17.74% |
Here, the difference is huge. A strategy that looked spectacular under a biased dataset collapses once historical constituents are included. The 20 smallest companies in the biased backtest grew more than five times faster than in the unbiased version. This example is intentionally extreme, but it shows how survivorship bias can completely change our conclusions. By contrast, when examining a portfolio of the 20 largest companies, the difference between current and historical data is significantly smaller, similar to the overall index results.
Building a Better Backtester
To remove survivorship bias, we rebuilt our backtesting engine so that each monthly rebalance uses the correct historical composition of the S&P 500.
We’ve collected complete constituent data going back to January 2013, covering more than twelve years of market history — including all additions and removals from the index. This ensures our backtests reflect how a strategy would have performed in real conditions, not in hindsight.
In the left chart, we can see illustrative results for the version with survivorship bias, and on the right, after its removal. The investment strategy settings are the same: 5-year period, long the 20 stocks with the smallest market capitalization, rebalance monthly.
Current S&P 500 Stocks
Historical S&P 500 Constituents
Conclusion
When developing investment strategies, the quality of your data and methodology matters as much as the model itself. Survivorship bias can easily make weak strategies look strong. The results of investment strategies executed without accurate backtesting tools can be affected by up to hundreds of percent.
At Analytical Platform, we’ve been refining our research software since 2018 to ensure accuracy, transparency, and reliability for analysts, researchers, and portfolio managers. Our system now integrates full historical index data, providing the necessary context for informed decision-making.
October 15, 2025, Jiří Fuchs, CCFR/Analytical Platform
Register today & enjoy one month
FREE trial of our application