We conducted a test to identify the most effective investment indicator/factor during January 2020 – July 2025. The output is an investment indicator that has been most successful in recent years. The article itself describes the procedure and methodology we used to determine this indicator.
Methodology
We used the Analytical Platform in two different modes:
| Approach | Description | Rebalancing |
|---|---|---|
| Factor-based | Tracks factor (indicator) performance. Compares the return of stocks with the highest indicator values (Q5) against those with the lowest values (Q1). Uses equally-weighted portfolio composition. | Monthly |
| Indicator-based | Tracks the performance of the top 20 stocks by the indicator. Uses score-weighted portfolio composition. | Monthly |
Example – Dividend Yield (DY):
- In the factor-based approach, Q5 = 100 companies in the S&P 500 with the highest DY.
- In the indicator-based approach, the portfolio holds the 20 companies with the highest DY. Both produce an equity curve of a hypothetical portfolio.
Results
The best-performing indicator was Variance 504.
| Approach | Return | Monthly Turnover |
|---|---|---|
| Indicator-based | +872% | 5% |
| Factor-based | Also significant | 5% |
Variance 504 – Explanation
- Definition: Statistical measure of the dispersion (volatility) of stock returns over the last 504 trading days.
- Meaning: Shows how far returns deviate from their average; higher variance typically implies higher risk and potentially higher returns.
- Use case: Helps investors assess overall risk and can be used as a selection metric in portfolio construction.
Practical Applications
It is evident that the Variance 504 Indicator shows remarkably positive outcomes in both approaches, which means the indicator seems to be effectively usable in portfolio construction.
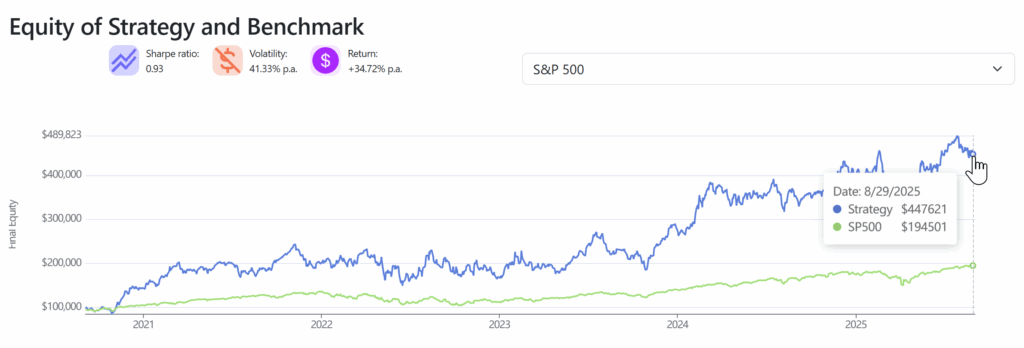
Portfolio based on Variance 504
- Composition: 10 stocks with the highest Variance 504.
- Weighting: Equally weighted (Performance is lower/less volatile due to the equally weighted approach).
- Performance: Outperformed the benchmark by more than 200% over the last five years.
- Cost efficiency: Reasonable, within monthly rebalancing.
Turnover & Costs
Turnover 5% implies roughly 6 interventions per year (12 rebalances × 10 stocks × 0.05 TO), which translates to ~60% of the portfolio replaced each year.
| Assumption | Implication |
|---|---|
| Bid–ask spread ~ 0.5% (5 ‰) | Trading cost ~ 0.8% (8 ‰) in year 1 |
| No longer a cost of portfolio composition in subsequent years | Trading cost ~ 0.3% (3 ‰) |
Comparison with ETFs
- Overall strategy cost is comparable to low-cost ETFs (TER 0.2–0.4%), yet performance significantly exceeds typical ETF returns in the same period.
- Note: In most jurisdictions, such a strategy generally does not qualify for capital gains tax exemptions applicable to long-term ETF holdings.
For the detailed methodology, calculations, and charts, feel free to write to us at app@analyticalplatform.com. You can also review the indicators you are interested in with our software.
September 3, 2025, Jiří Fuchs, CCFR/Analytical Platform
Register today & enjoy one month
FREE trial of our application