Jointly with Masaryk University and Mendel University in Brno, we have been exploring how the volume and sentiment of financial articles influence subsequent stock price movements. In today’s article, we will present the conclusions of our study, which can be utilized to create advanced market sentiment investment strategies. In other words, we will examine whether it is possible to obtain excess returns or, otherwise, improve the parameters of an investment portfolio by investing in stocks with certain volume and sentiment characteristics.
Data & Methodology
Financial articles aggregation
First, let’s examine what news we evaluate and where we get our sentiment. As part of our analysis, we analyze millions of articles published between 2020 and 2024 that discuss stocks from the S&P 500 index.
In the first step, individual stocks are identified in the articles, and it is determined whether they are discussed negatively, positively, or neutrally. This is assessed on weekly time frames, while total attention is also monitored.
Alternative Attention Measures
In the second step, we clean the data to reflect the change over the long-term trend. For a specific period, a company can simultaneously experience equal magnitudes of positive and negative attention. Examining only the absolute counts of individual sentiment categories makes it difficult to assess whether the overall sentiment leans toward positive or negative. To address this limitation, we construct normalized signal measures that capture the relative composition of sentiment:
- Negative signal – ratio of negative attention to total attention
- Positive signal – ratio of positive attention to total attention
- Neutral signal – ratio of neutral attention to total attention
These signal measures provide a standardized view of sentiment composition. Next, we employ a relative comparison of attention. The attention is likely strongly correlated with the size of the company and the industry in which it operates. Therefore, the attention should be scaled to the ’typically’ observed attention for that specific company. We therefore calculate (empirical) quantiles of attention for each company.
It also might be that the overall attention towards the stock market increases (for example, during times of extreme prices). This can inflate the attention measures as well for all stocks. For example, a given company can have a historically high negative attention at 0.9, meaning that the negative attention for that company was highest only in about 10% of trading days. However, for all other stocks, this can be > 0.90 as there is an overall negative sentiment on the markets. We therefore perform a second scaling across stocks.
This helps us identify that, for example, a given stock has negative attention that is not only historically the highest for that company, but also no other company in the sample achieved its historically highest negative attention.
Portfolio sorting
The next step is to build a stock portfolio. We construct and evaluate long-only portfolio strategies by ranking stocks according to various factors. Due to the persistent upward market trend over the sample period, we exclude short and long-short strategies, as they consistently underperform. At each period (e.g., weekly), stocks are ranked by a specified factor, and a certain number of top stocks is selected to form an equal-weighted long-only portfolio. The benchmark consists of an equal-weighted portfolio of all available stocks. We compute the average return of each portfolio over time and track its constituent tickers, generating a time series of returns for comparative analysis.
Portfolios are constructed using varying values of stocks, ranging from 10 to 100, from a universe of S&P 500 stocks. This approach allows us to examine the robustness of factor performance across different portfolio sizes. To assess the robustness of our results over different periods, we split the initial sample (2020-2024) into two subsamples: 2020-2022 and 2023-2024.
Advanced Momentum Strategy
The key question is how to select the optimal number of stocks for portfolio sorting strategies. Therefore, we apply the following momentum-based strategy: we examine the last 6 months to determine which number of stocks provided the best results and select this number for the following week. This approach is applied to all observations in a rolling window format. This strategy allows for the dynamic selection of the optimal number of stocks through time.
Results
The Top 80 and Top 100 negative sentiment portfolios achieve the highest Sharpe ratios (1.177 and 1.176, respectively) over the full sample period, outperforming both the benchmark (1.029) and another benchmark strategy, ReturnTop20[1] (0.986).
This superiority is particularly evident in the post-2023 subsample, where the Top 20 portfolio delivers an exceptional Sharpe ratio of 2.053 compared to 0.852 for the benchmark. However, during the 2020- 2022 period, results were much closer to the benchmark, with the Top 80 strategy achieving the best performance at 1.126 versus the benchmark’s 1.179. Overall, the Top 80 strategy demonstrates consistent outperformance relative to the benchmark across both subsamples.
Negative sentiment strategies exhibit lower average drawdowns (-2.7% for Top 80 vs. -3.8% for Benchmark) and higher return-to-drawdown ratios (7.3 for Top 80 vs. 4.6 for Benchmark), indicating enhanced defensive performance during market stress. RetTop20 generates marginally higher absolute returns than the Benchmark (19.24% vs. 17.27%) but experiences elevated volatility (19.51% vs. 16.78% standard deviation) and deeper maximum drawdowns (-22.63% vs. -19.22%). Its risk-adjusted performance (Sharpe ratio: 0.986) underperforms relative to negative sentiment portfolios.
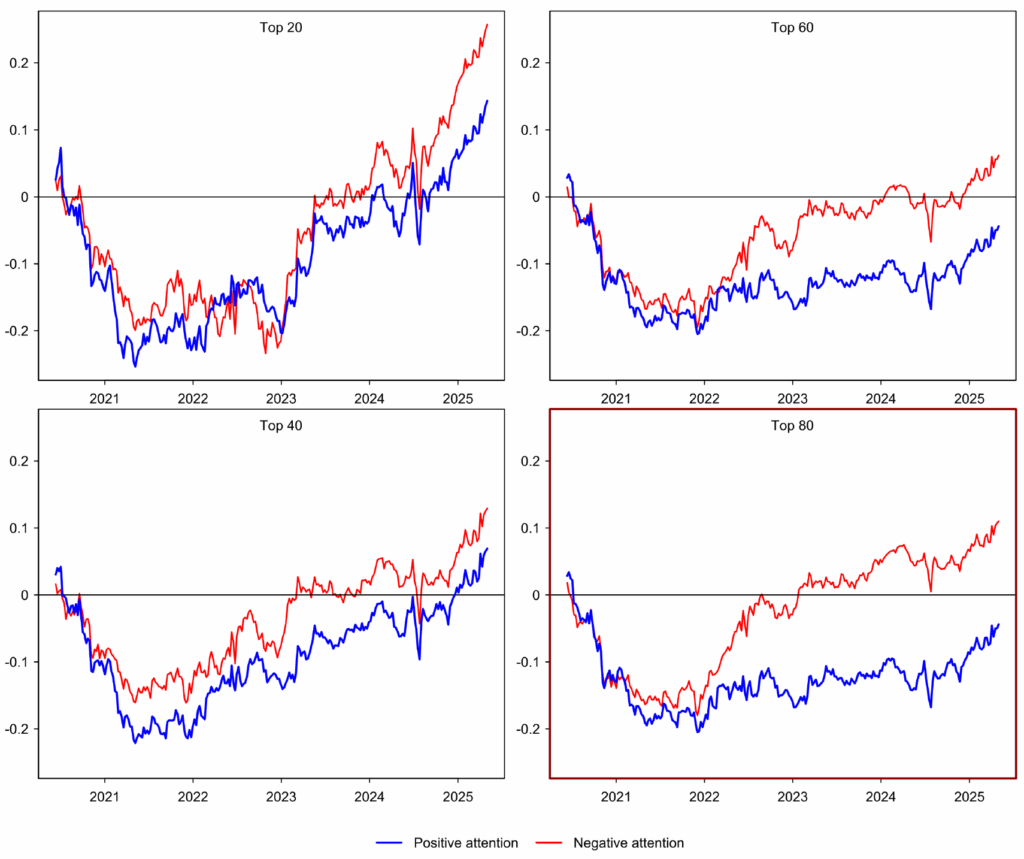
The best results appear to be achieved by the simplest version of factors based on overall negative, positive, or neutral sentiment. Negative sentiment provides the strongest signals among the three approaches. Selecting a lower number of stocks to form a portfolio (around 20) can exceed the benchmark most significantly, but only in the second subsample (red line), while underperforming in the first subsample (blue line). When the number of stocks increases to approximately 80, it becomes evident that the benchmark is often outperformed across all subsamples, providing the most stable returns over time.
Advanced Momentum Strategy
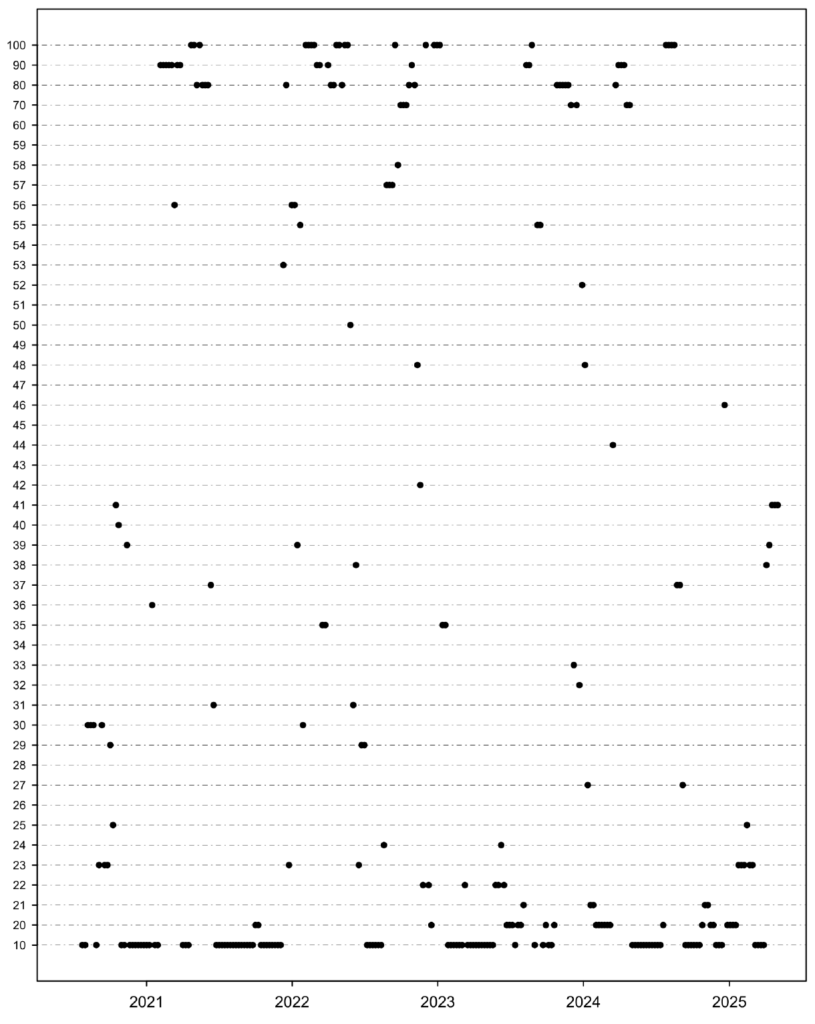
Rather than maintaining a static portfolio size, we suggest a dynamic selection mechanism that optimizes the number of constituent stocks based on historical performance patterns.
The momentum-based approach employs a rolling 6-month lookback window to identify the optimal portfolio size. Specifically, the algorithm evaluates the performance of various portfolio configurations (ranging from 10 to 100 stocks) over the preceding six months and selects the configuration that delivered the superior Sharpe ratio for implementation in the subsequent trading period. This adaptive framework addresses the fundamental challenge of optimal portfolio concentration by allowing the strategy to dynamically adjust between concentrated positions (during periods favoring focused exposure) and broader diversification (when market conditions reward wider stock selection).
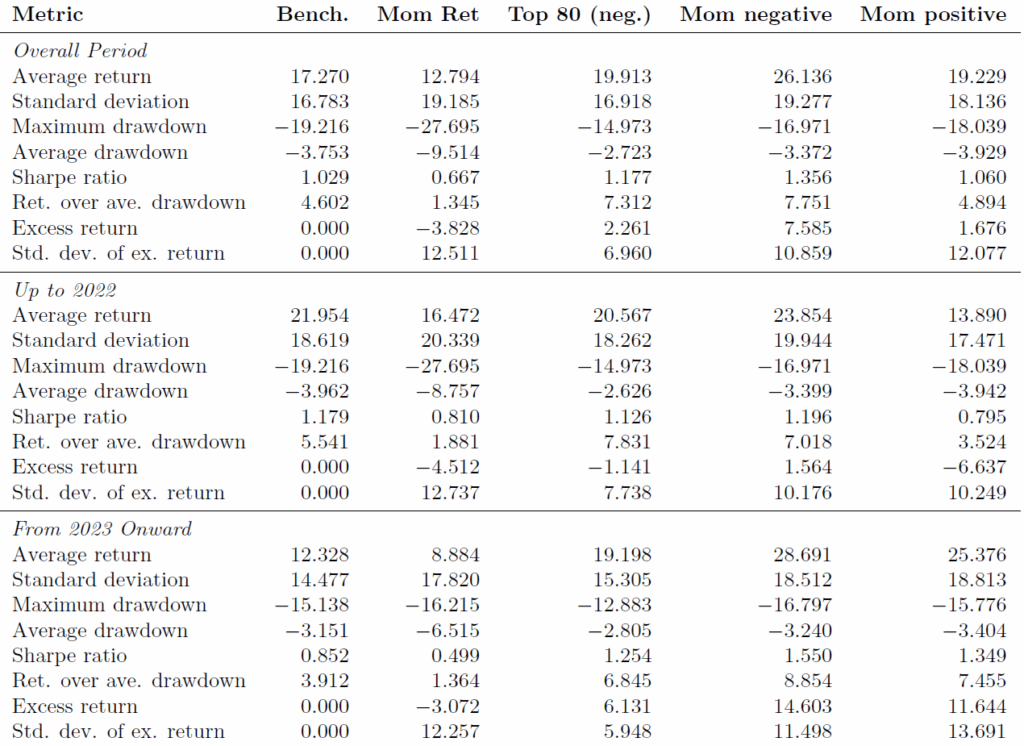
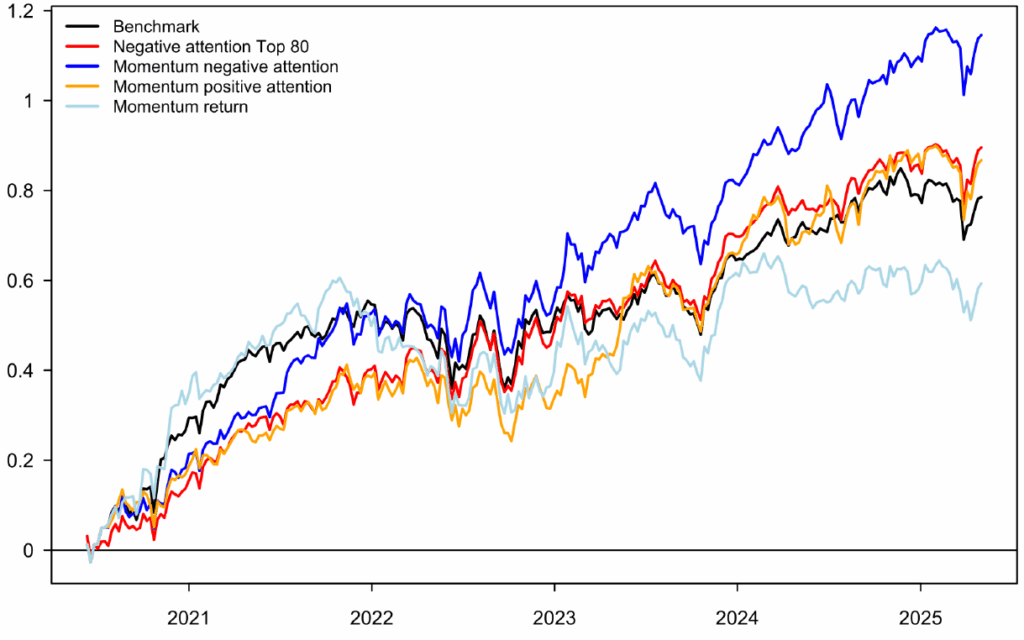
The approach represents a systematic method for capturing time-varying optimal portfolio characteristics while maintaining disciplined factor exposure. The results from our momentum strategy are described in the Table and Chart below. The columns include the benchmark and Top 80 (neg.) strategy for comparison. The momentum strategy is then applied to return momentum, negative attention, and positive attention factors, selecting the number of stocks based on the previous 6 months’ results.
The momentum negative sentiment strategy achieves the highest returns (26.13%) and best Sharpe ratio(1.356), significantly outperforming all other approaches.
Conclusion
The empirical analysis of portfolio strategies based on negative sentiment signals, return momentum, and benchmark performance yields several critical insights.
First, portfolios constructed using aggregated negative sentiment scores — particularly the Top 80 and Top 100 strategies — demonstrate consistent outperformance in risk-adjusted returns (Sharpe ratios of 1.177 and 1.176, respectively) compared to both the equal-weighted benchmark (1.029) and short-term return momentum strategies (e.g., RetTop20: 0.986). This superiority is driven by their enhanced defensive characteristics, including lower average drawdowns (-2.7% vs. -3.8% for the benchmark) and higher return-to-drawdown ratios (7.3 vs. 4.6), underscoring their resilience during market stress.
The robustness of the Top 80 strategy across subsamples (2020–2022 and 2023–2024) suggests that negative sentiment signals capture persistent alpha opportunities, likely rooted in behavioral dynamics such as investors overreacting to adverse news. The pronounced post-2023 outperformance (e.g., Top 20 Sharpe ratio: 2.053 vs. benchmark: 0.852) further indicates evolving market conditions where sentiment-driven mispricing has become increasingly exploitable. In contrast, return momentum strategies, while generating marginally higher absolute returns, exhibit elevated volatility and drawdowns.
We further enhance the results by implementing dynamic stock selection using a 6-month rolling window. The strategy centered on negative sentiment factors delivers the strongest performance, significantly outperforming both the benchmark and alternative strategies.
These findings demonstrate that adaptive negative sentiment strategies substantially exceed static approaches, particularly under recent market conditions. The dynamic selection mechanism proves most effective when applied to negative sentiment signals, indicating that strategic timing of contrarian positions generates superior alpha compared to fixed portfolio construction methods.
For the detailed methodology, calculations, and charts, feel free to write to us at app@analyticalplatform.com. You can also use the results of our analysis in the Market Sentiment and Factor Investing software applications.
June 6, 2025, Jiří Fuchs, CCFR/Analytical Platform
Source: Research Report: CCFR Sentiment Factors, Štefan Lyócsa, Tomáš Plíhal, Daniel Stašek
[1] The ReturnToP20 strategy is a simple momentum strategy that always invests in the 20 stocks with the highest returns in the previous week.
Register today & enjoy one month
FREE trial of our application