+45%. +48%. +36%.
Random?
No.
Before the move, the top-performing stocks were ranked at the very top of the PLUS DI 252 indicator across the S&P 500 universe.
PLUS DI 252 Indicator Explanation
PLUS DI 252 measures long-term directional strength over 252 trading days (~1 year). It identifies structural buying pressure — not short-term noise.
High indicator values signal persistent accumulation, trend continuity, and structural momentum.
January was not a spike. It was a continuation.
PLUS DI 252 Ranking — Dec 31, 2025
| Company | Ticker | Rank Dec 31, 2025 | Jan 2026 |
|---|---|---|---|
| Micron Technology | MU | 1st | +45% |
| Western Digital | WDC | 2nd | +45% |
| Seagate Technology | STX | 4th | +48% |
| Intel | INTC | 5th | +26% |
| Lam Research | LRCX | 7th | +36% |
The Edge Is Structural
In the Analytical Platform, we don’t chase performance. We analyze characteristics before performance emerges.
Within the Indicator Investing app, these indicators/factors are not treated as abstract academic concepts, but as measurable stock characteristics that can be systematically ranked, filtered, and combined. Each indicator — including PLUS DI 252 — represents a specific structural attribute. Rather than focusing on isolated returns, the platform evaluates how strongly a given characteristic dominates within the selected universe and how persistent that dominance is over time.
This characteristic-driven approach shifts the perspective from “which stock is rising?” to “which structural traits are currently leading the market?” Users can then construct portfolios around those traits, adjusting concentration, time horizon, directional exposure, and leverage to test how different characteristics behave under changing market conditions. Backtesting metrics such as CAGR, Sharpe ratio, and volatility help quantify whether a characteristic reflects temporary noise or a durable structural pattern across regimes.
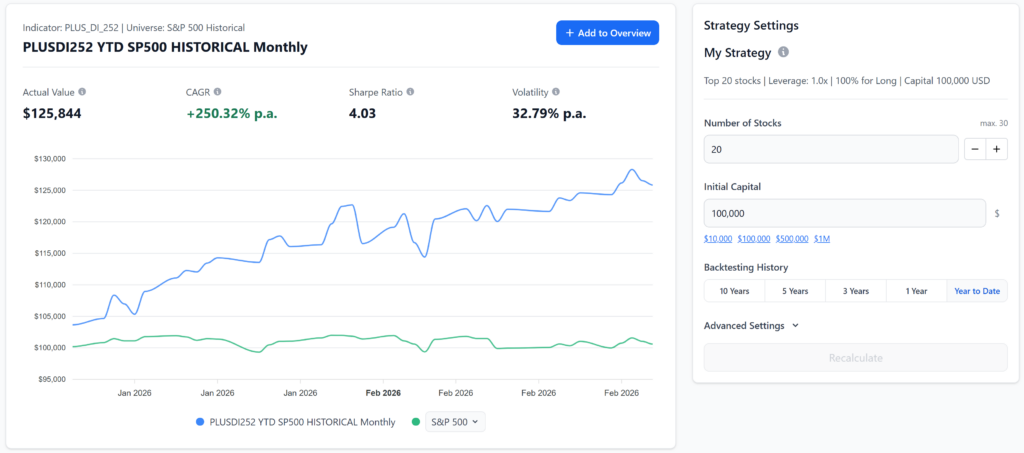
Model Portfolio Settings
Once an initial indicator is selected, the platform displays the complete stock ranking within the defined universe. From there, we can build and test model portfolios by modifying the time horizon, portfolio size, long/short allocation, and leverage.
February 23, 2025, Jiří Fuchs, CCFR/Analytical Platform