The Indicator Investing application allows users to build, compare, and execute quantitative investment strategies based on ranked portfolios of stocks. This documentation explains how the application works, how strategies are structured, and how individual screens interact.
Terminology
The terms used in our application are closely related, so let’s explain them first.
- Indicator = Portfolio of 20 Stocks, system-set; the number of shares cannot be changed. An indicator is expressed as a portfolio built from the top 20 or bottom 20 stocks.
For instance, ‘S&P 500 Monthly Market Cap 3 Y’ stands for the Market Cap indicator. It is calculated as a portfolio composed of 20 stocks with the highest Market Capitalization, rebalanced monthly over 3 years. Whichever side (highest or lowest values) grows faster historically determines which group is initially selected. See the backtester documentation. - Strategy = Portfolio with a varying number of stocks, based on the user’s preferences. A strategy represents a full portfolio whose performance, composition, and parameters we can manage and analyze.
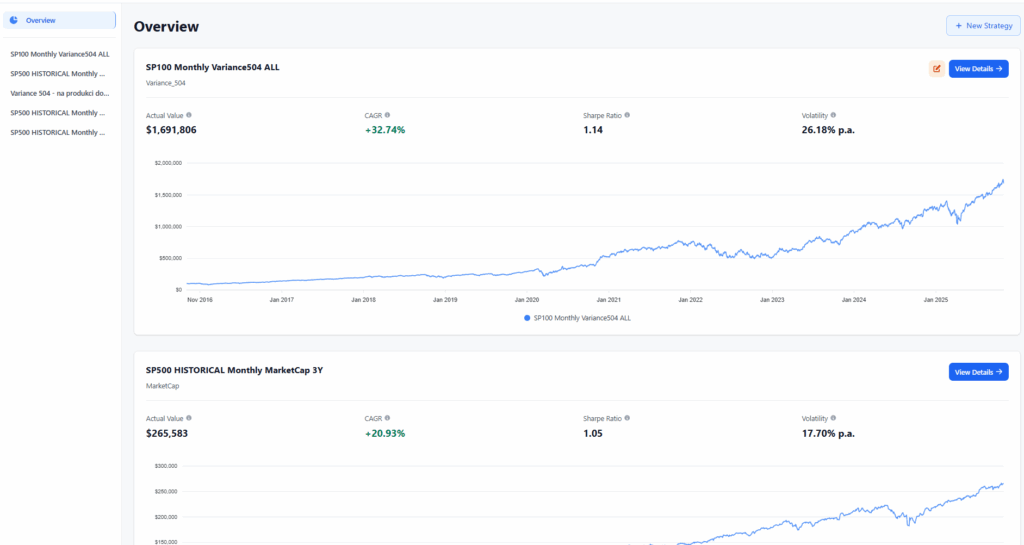
Overview
The Overview page acts as the user’s central hub for monitoring and comparing all strategies. It provides:
- Performance of all strategies. A visual comparison of cumulative returns and stability of each strategy created by the user.
- Correlation matrix. Correlation between all strategies helps users identify overlapping exposures or diversification opportunities.
- Navigation layer. From here, users can open the detail page of any strategy or start creating a new one.
The Overview, therefore, combines portfolio monitoring, comparison tools, and navigation into a single dashboard.
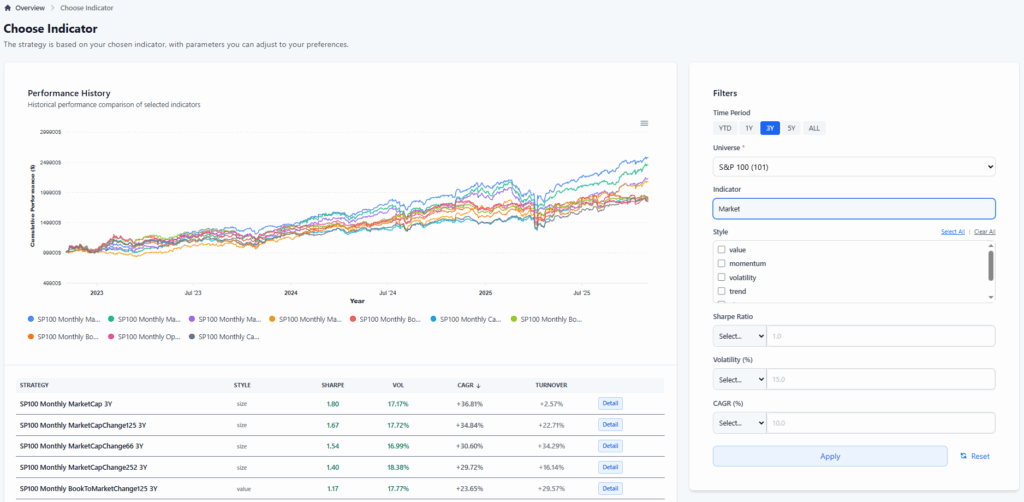
New Strategy
The New Strategy screen allows users to select and compare investment indicators through automated backtesting.
- It enables us to compare investment indicators based on a backtest of a portfolio comprising 20 stocks.
- From here, we can navigate to the Strategy Detail page to continue working with the portfolio.
Once the indicator selection is complete, the user proceeds to the Strategy Detail page, where the portfolio can be further customized and optimized.
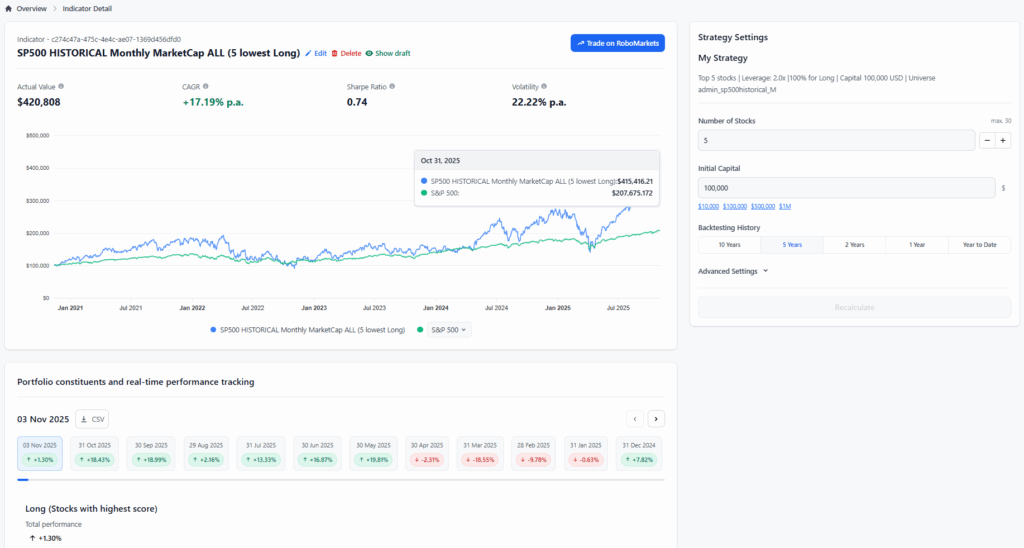
Strategy Detail
The Strategy Detail page provides a full analytical environment for understanding and refining the strategy.
- Overall portfolio performance, cumulative return, drawdowns, and long-term stability of the strategy.
- Historical portfolio constituents, returns for each monthly rebalance, including which stocks were added or removed based on updated rankings.
- Current holdings and returns.
The system recalculates predictions and backtests (see the methodology) based on editable settings. Users can refine the portfolio by adjusting:
- Number of stocks.
- Initial capital.
- Backtest duration.
- Leverage.
- Ranking rule (High Score, Low Score).
- Position type (Long, Short, Long–Short).
Integration and Execution
From this page, users can:
- Add the strategy to the Overview for monitoring.
- Send orders directly to the broker to execute the strategy live.
The Strategy Detail page, therefore, serves as the operational and analytical center for each strategy.