This document outlines how the Analytical Platform backtester handles universes, data, biases, dividends, and monthly strategy execution. It provides transparency for interpreting results and comparing strategies consistently.
Survivorship Bias
Backtester allows switching between the Current Composition and the Historical Composition of the universes used.
- For the S&P 500, full-quality Historical Composition is available from January 2013 onward.
- Other indices may only offer Current Composition data.
Using the Current Composition is survivorship-biased; read more.
Data Quality and Availability
Data quality varies based on region and history:
- S&P 500 Current Composition: High-quality data from 2013 onward.
- Older delisted tickers: Some may be missing historical data.
- European stocks: Data tends to be less complete.
For long backtests that may be affected by missing historical data, users should check the downloadable CSV file with sorted stocks.
Fees, Spreads, and Inflation
The following adjustments are not included in the backtest results:
- Trading fees.
- Spreads.
- Inflation.
However, dividends and earnings are included in cumulative performance, assuming they are continuously reinvested.
Backtest Calculation Methodology
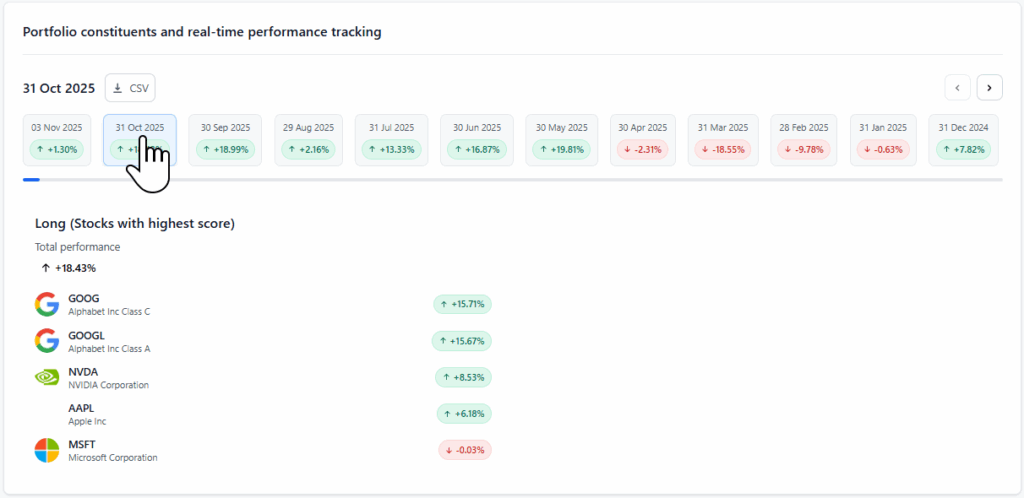
Monthly Rebalancing
At the end of each month:
- The closing price from the last trading day of the month is used.
- Indicators for the following month are calculated using this price.
- Stocks are ranked based on the indicator values.
Ranking and Strategy Logic
Depending on the strategy type:
- High Score Strategy: Selects stocks with the highest indicator values.
- Low Score Strategy: Selects stocks with the lowest indicator values.
- By default, stocks are sorted according to the indicator direction, which is determined based on whether the 20 stocks with the highest indicator value or the 20 stocks with the lowest indicator value had a higher total return in the assessed interval.
Portfolio Weighting
- The portfolio is equally weighted. Every selected stock has the same share of capital invested at the beginning of each month.
- Benchmarks are calculated based on their historical (usually market-cap-weighted) composition.
Price Usage in Performance Calculation
Price movements are based on:
- The closing price from the last trading day of the previous month.
- The closing price from the final trading day of the next month. In the case of the last unclosed month, the data is updated continuously.